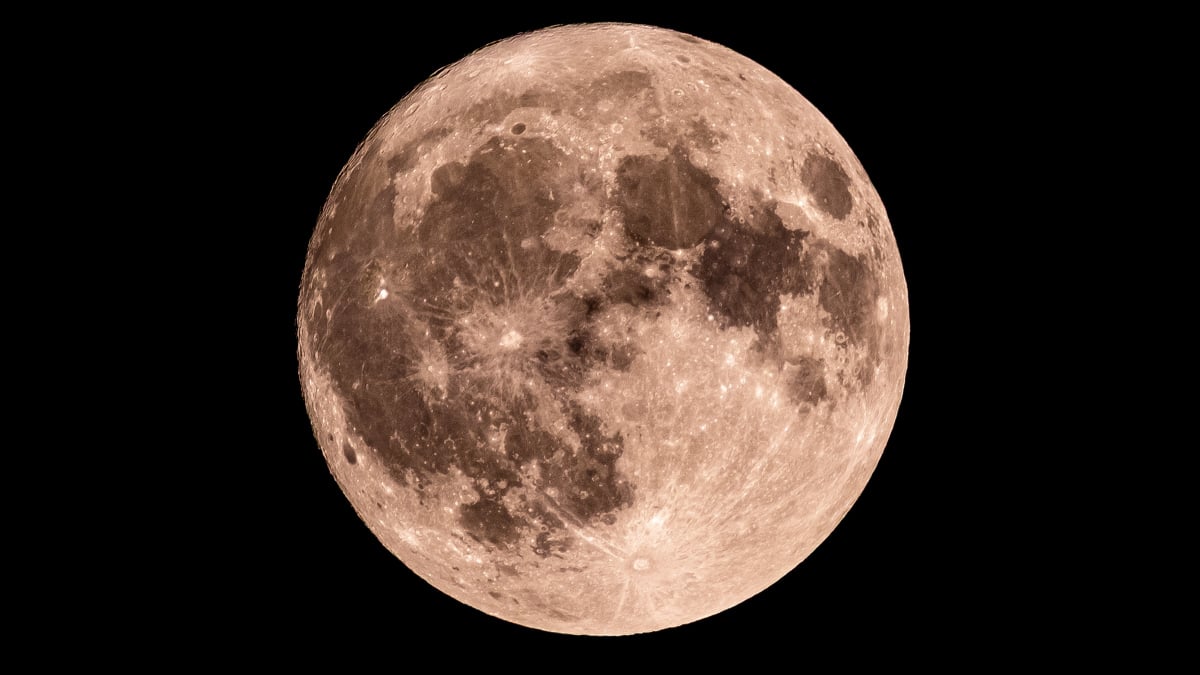
Tonight, the Moon looks slightly slimmer again as it approaches the Third Quarter. Its illuminated section is fading even more, meaning each night there’s less for us to see.
Category: 7. Science
-
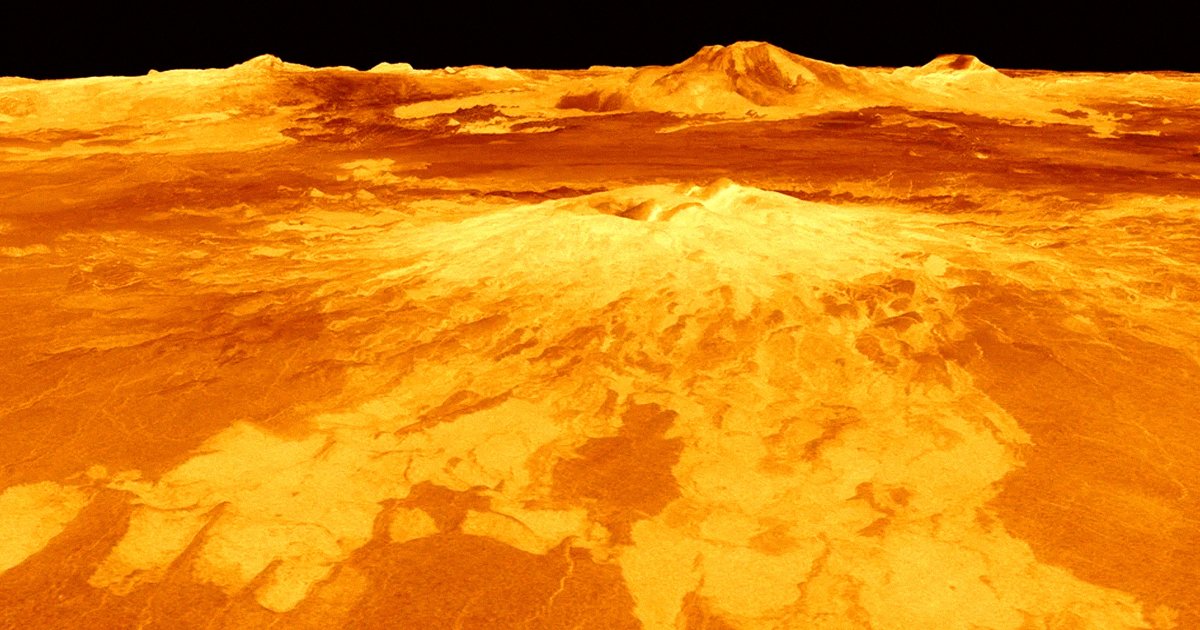
Scientists Intrigued by Possible Hollow Structures Under Surface of Venus
Venus has long been known as Earth’s evil twin. While they both are roughly the same size and formed in the same inner region of the solar system, Venus is far less hospitable to life as we know it. Its surface temperatures can reach over…
Continue Reading
-
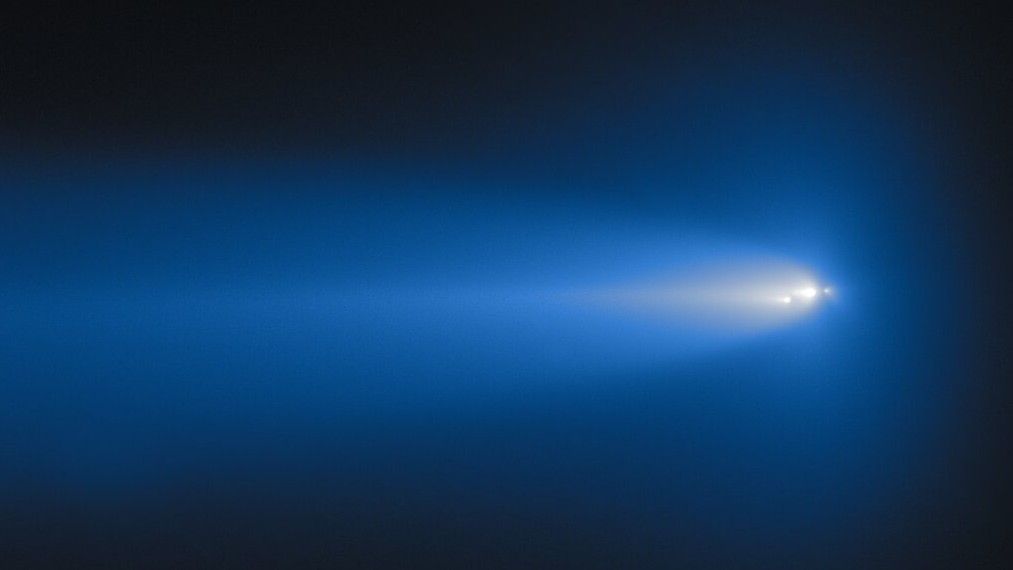
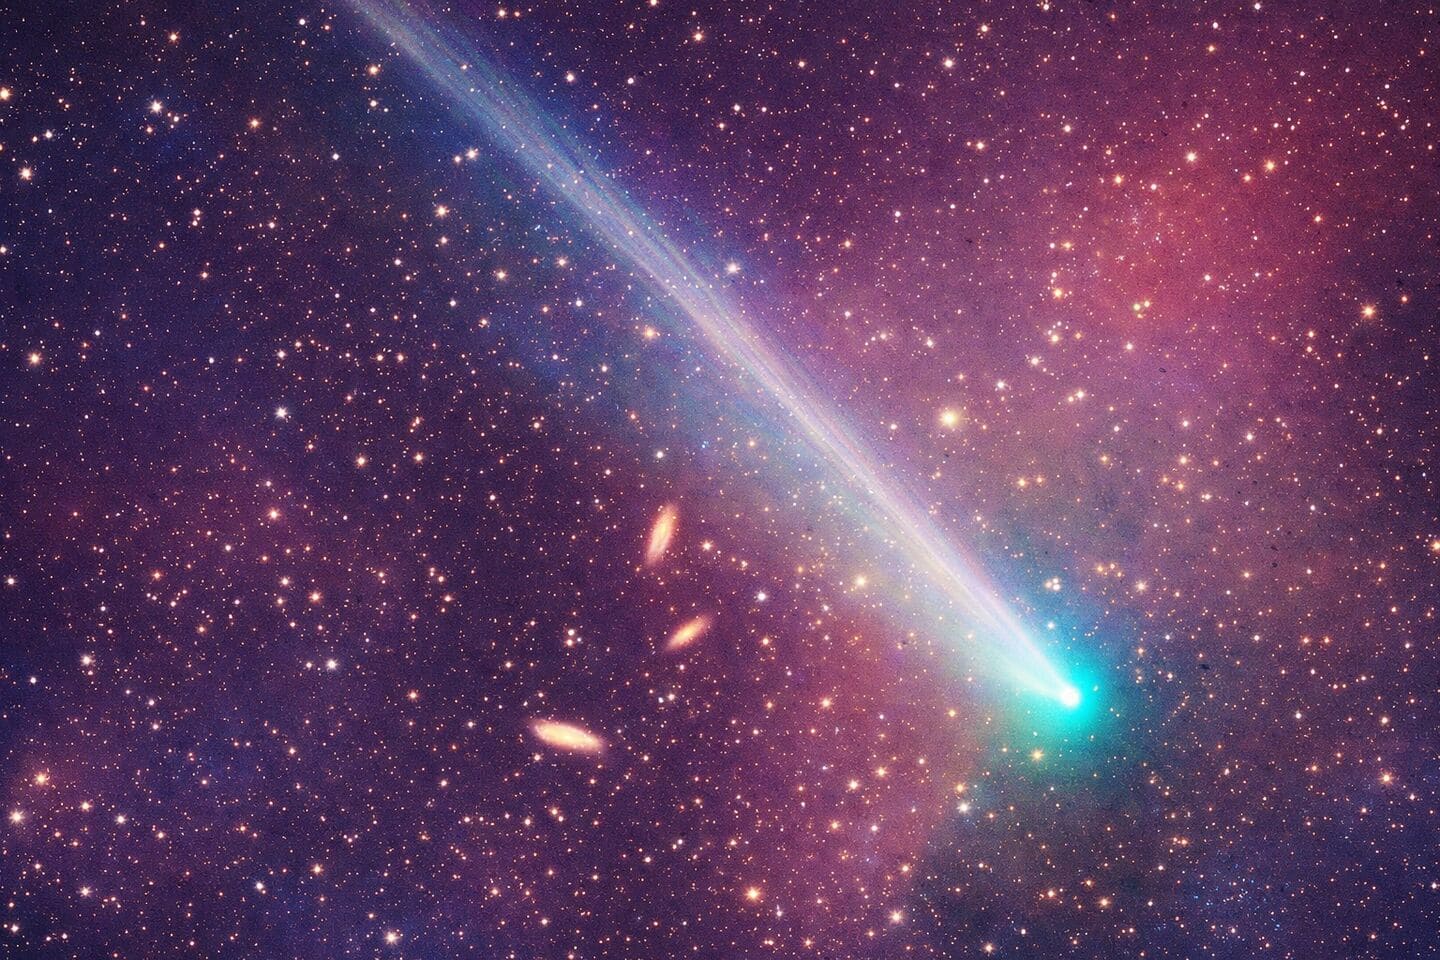
Dramatic death of Comet C/2025 K1 (ATLAS) caught on camera — Space photo of the week
QUICK FACTS
What it is: Comet C/2025 K1 (ATLAS)
Where it is: 220 million miles away, in the constellation Pisces
When it was shared: Jan. 28, 2026
Just as the mythological Icarus melted his feathers and wax wings when he flew too close to the sun,…
Continue Reading
-
Pulsar clocks hint at massive dark matter clump hiding in Milky Way
Astronomers have spent decades hunting for dark matter by looking for light that isn’t there — and that strategy has mostly failed.
Now, a team of researchers has tried something radically different. Instead of searching the sky, they…
Continue Reading
-
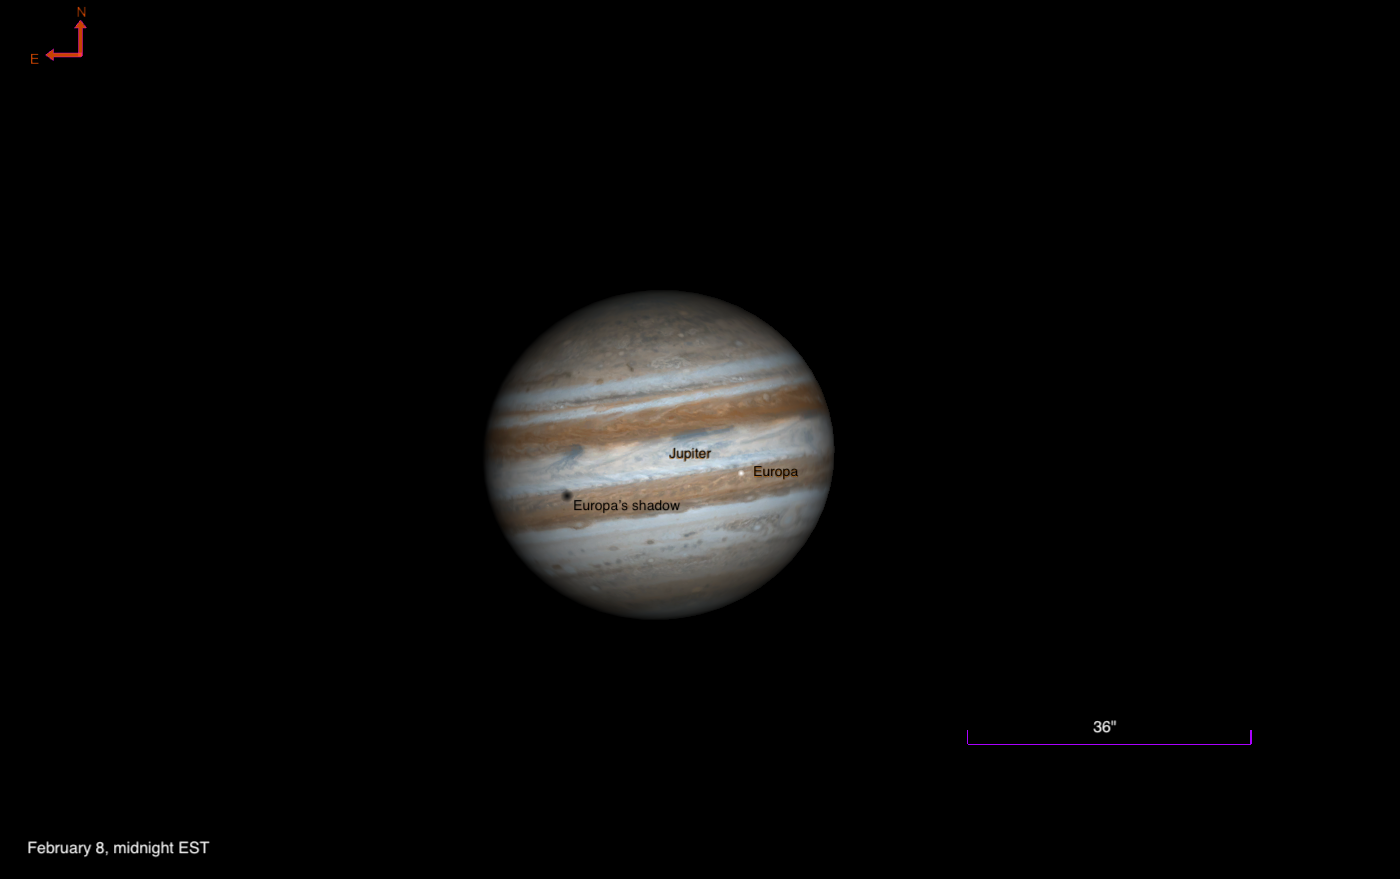
Europa takes a trek across Jupiter
The icy moon Europa transits Jupiter tonight, followed by its shadow. Now past opposition, moons and their shadows are well separated.
Around midnight…
Continue Reading
-
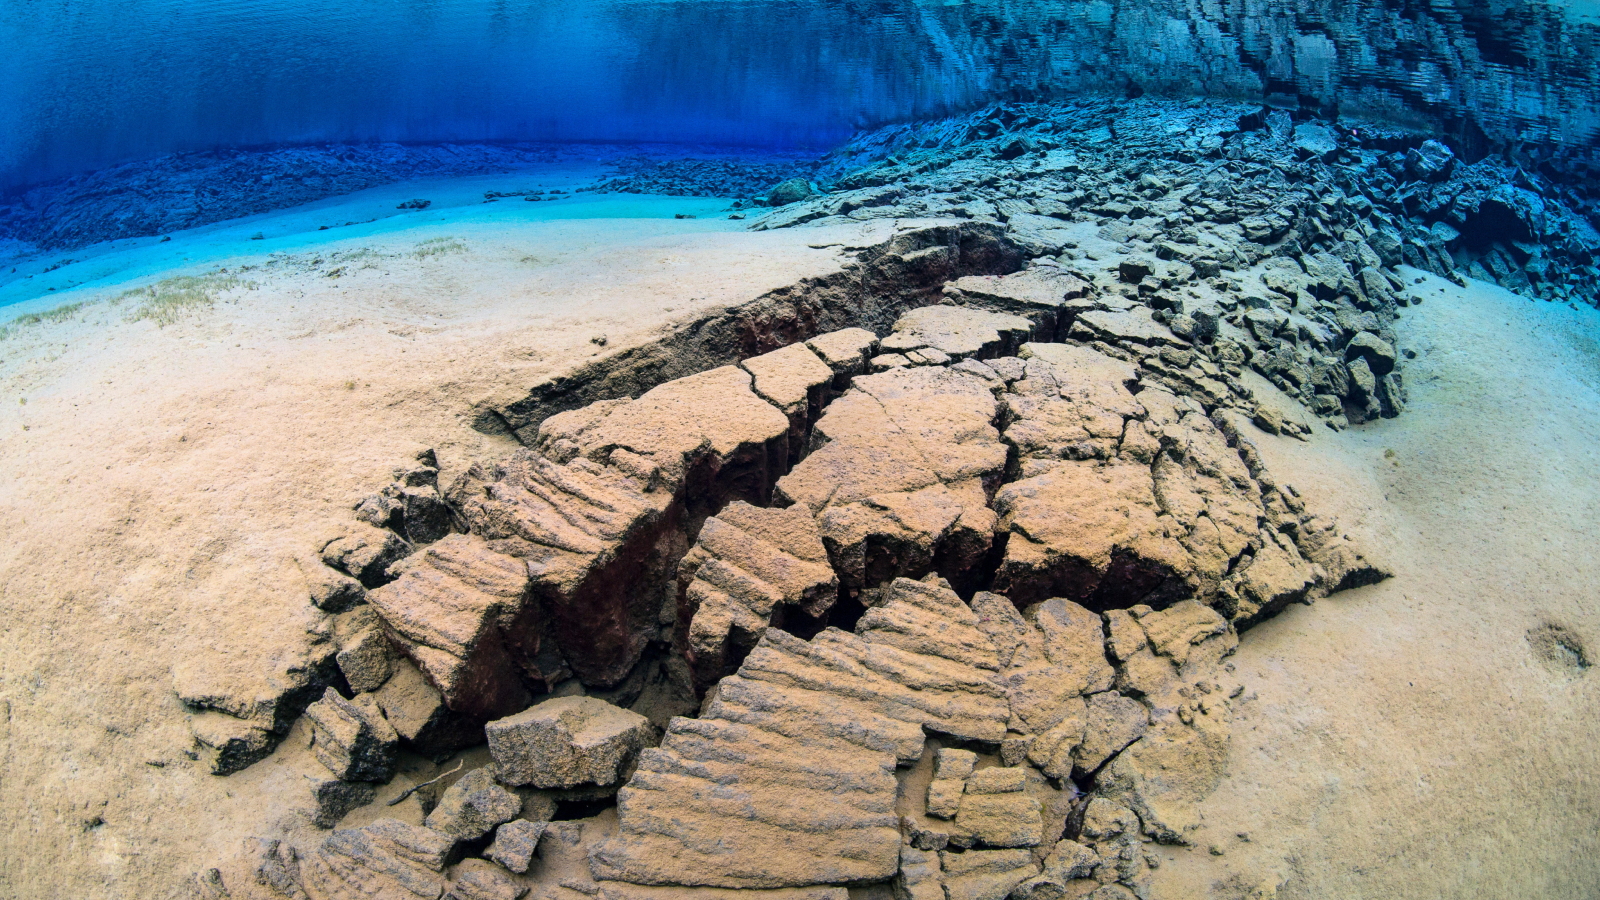
‘Maybe they’re waiting for something that only happens thousands of years later’: The hidden life ‘sleeping’ deep beneath Earth for millions of years
Beneath Earth’s surface lies a kingdom of undiscovered microscopic life. These “intraterrestrials” survive in some of the harshest conditions on the planet — and scientists are hunting for these microbes.
In this excerpt from “
Continue Reading
-
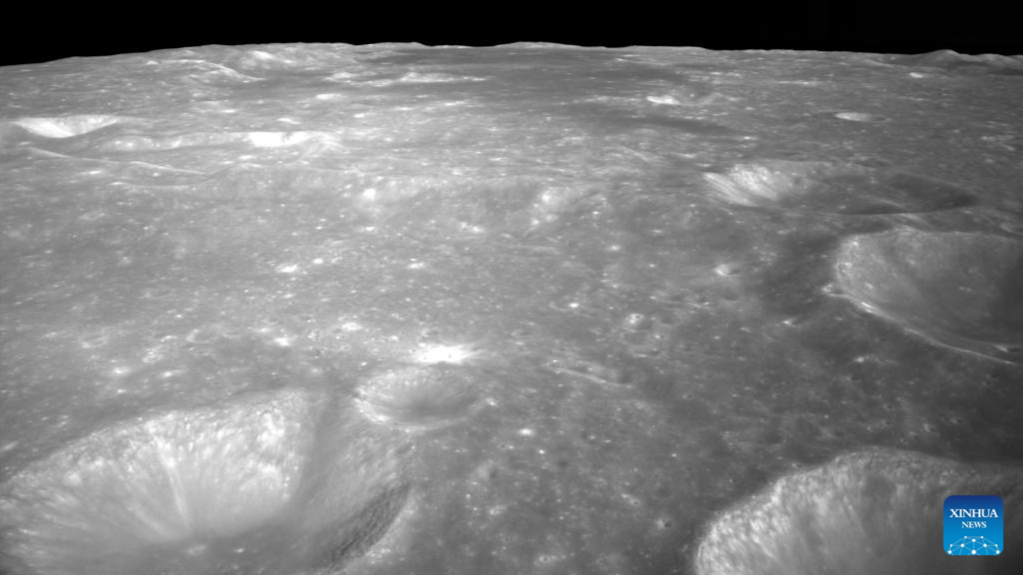
Scientists make breakthrough in lunar chronology with Chang’e-6’s moon samples
This image released by the China National Space Administration (CNSA) on June 4, 2024, which was taken with the landing camera on the lander of the Chang’e-6 probe, shows a view of the lunar surface. (PHOTO / CNSA VIA XINHUA) BEIJING – For the…
Continue Reading
-
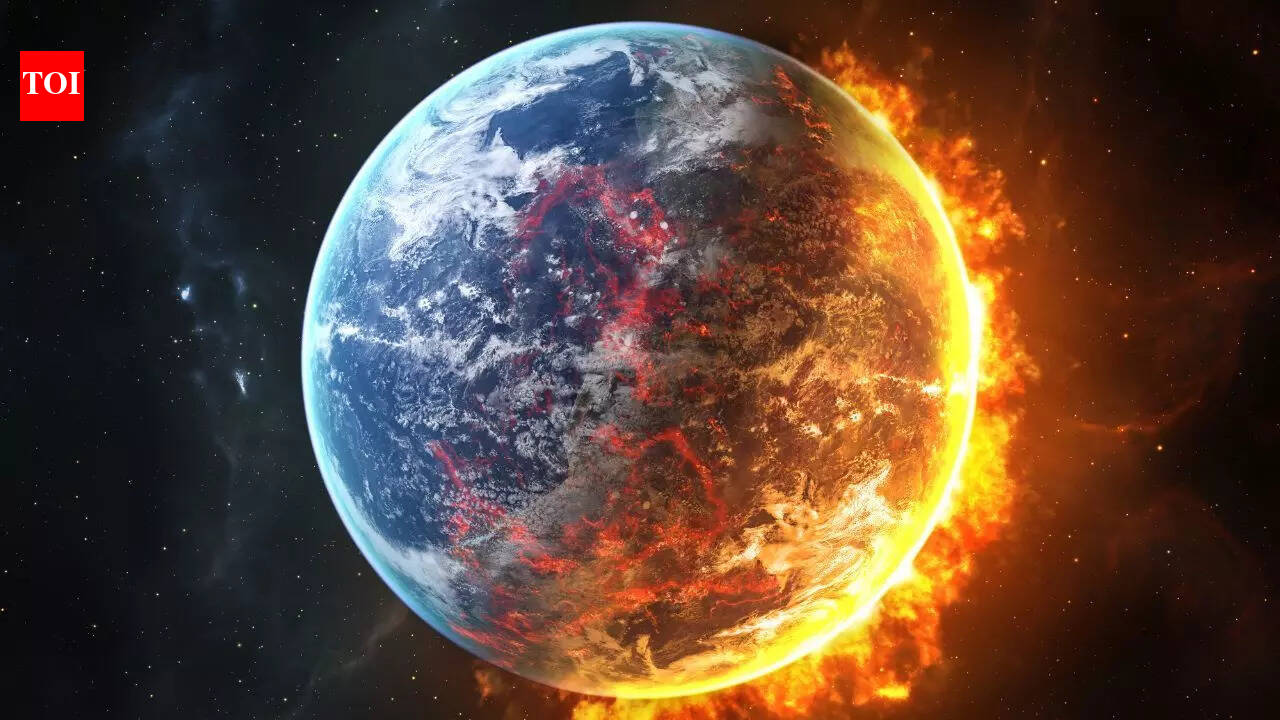
The Sun could one day vapourise Earth: Scientists reveal the planet’s terrifying end |
It almost sounds like a sci-fi movie. But scientists say something like this could really happen to Earth, just not for billions of years. Astronomers have spotted a bizarre strip of iron stretching across the Ring Nebula, like a cosmic bar…
Continue Reading
-
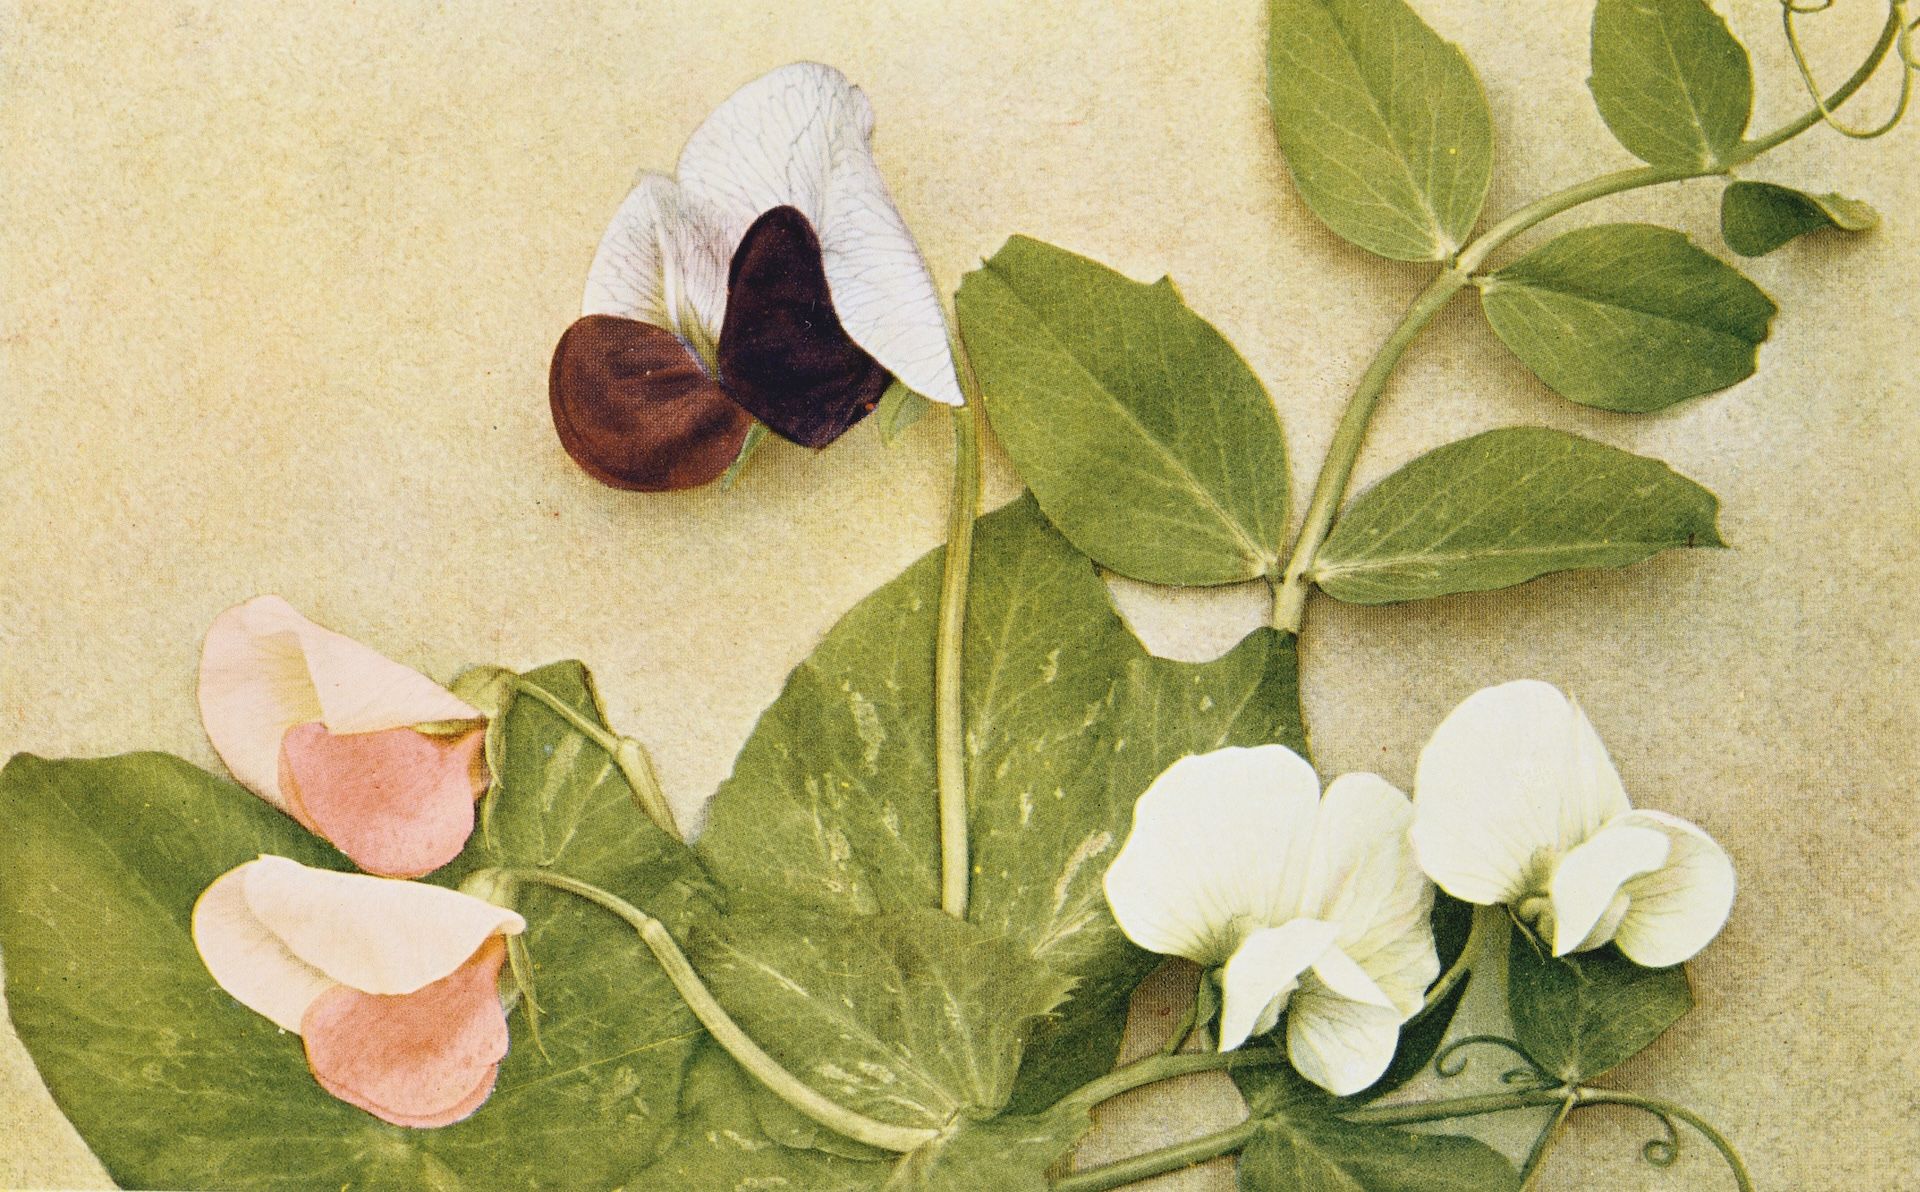
Science history: ‘Father of modern genetics’ describes his experiments with pea plants — and proves that heredity is transmitted in discrete units — Feb. 8, 1865
Milestone: Principles of inheritance discovered
Date: Feb. 8 and March 8, 1865
Where: Brno, in what is now the Czech Republic
Who: Gregor Mendel
On a cold day in February, an Augustinian friar described his experiments breeding garden-variety…
Continue Reading