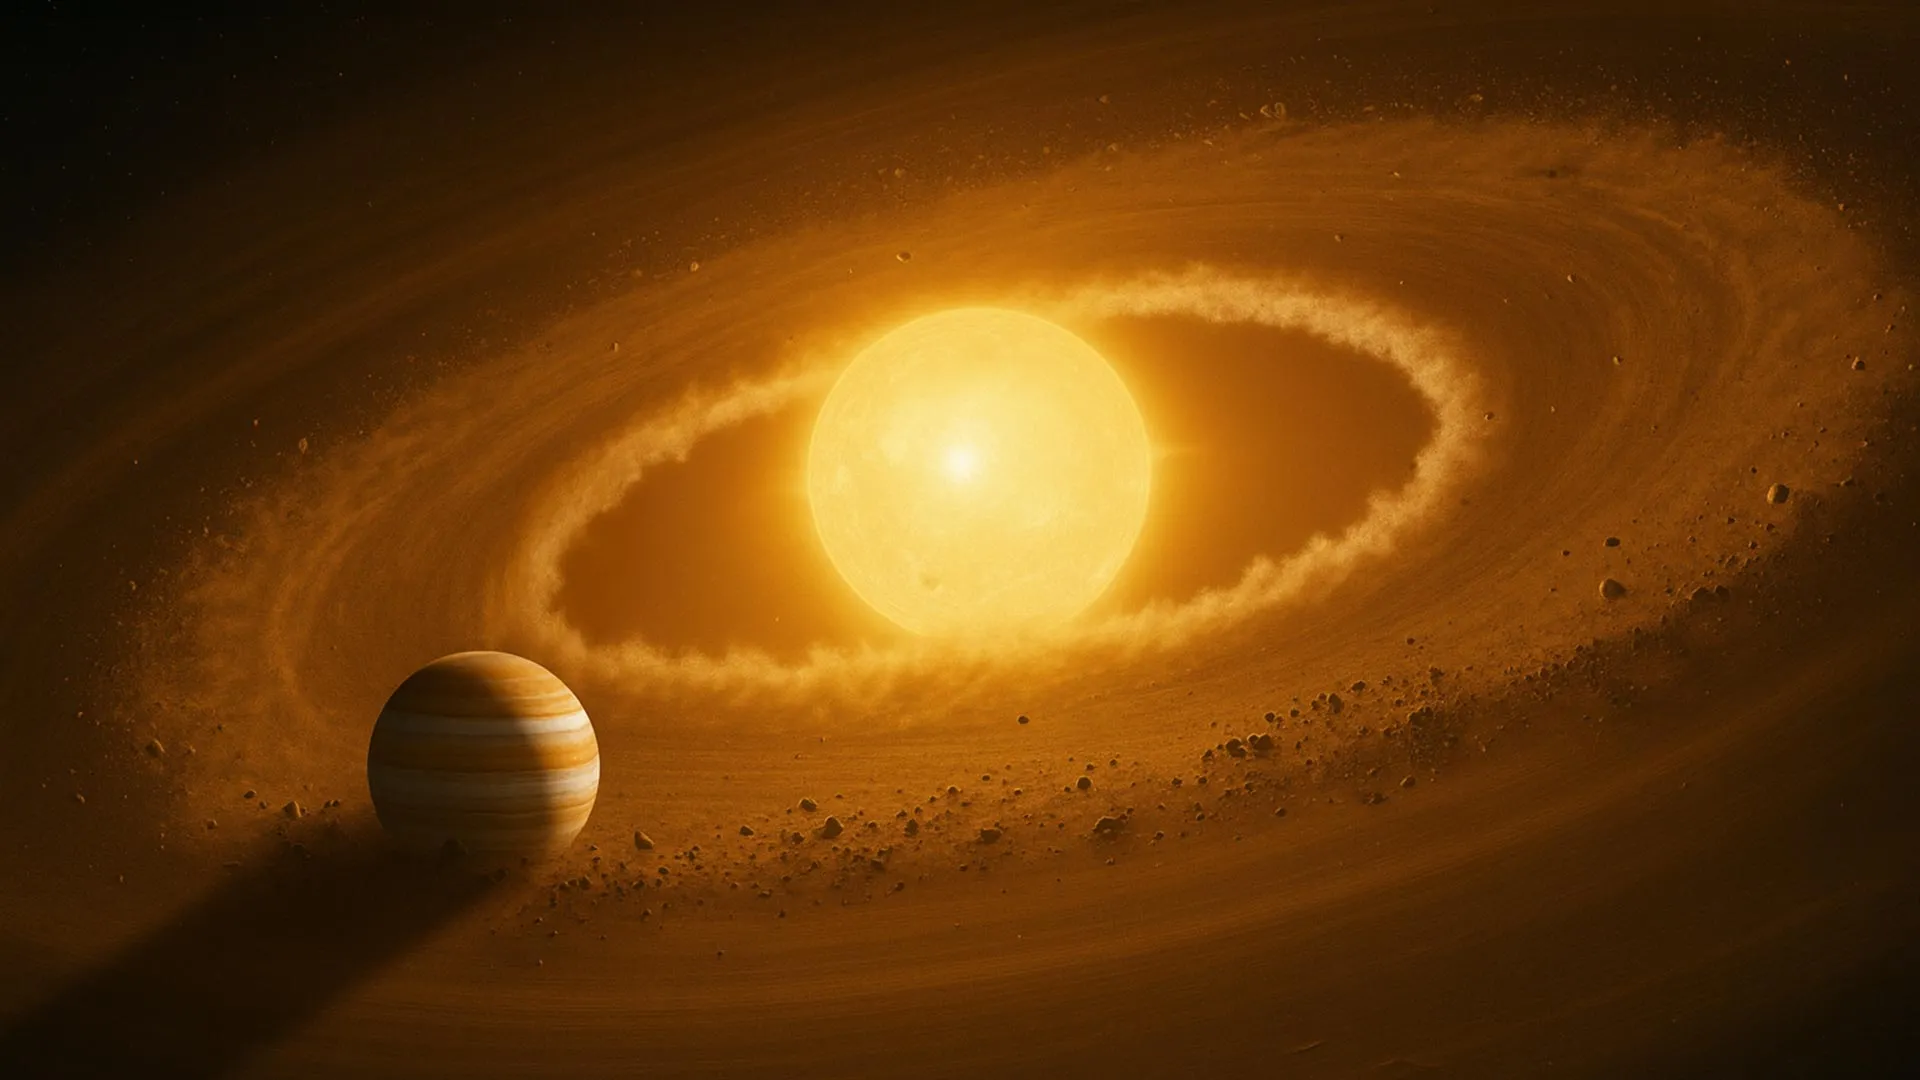
The first exoplanet ever confirmed in 1995 turned out to be what researchers now describe as a “hot Jupiter,” a giant world similar in mass to Jupiter but orbiting its star in only a few days. Scientists now think these planets originally formed…
Category: 7. Science
-
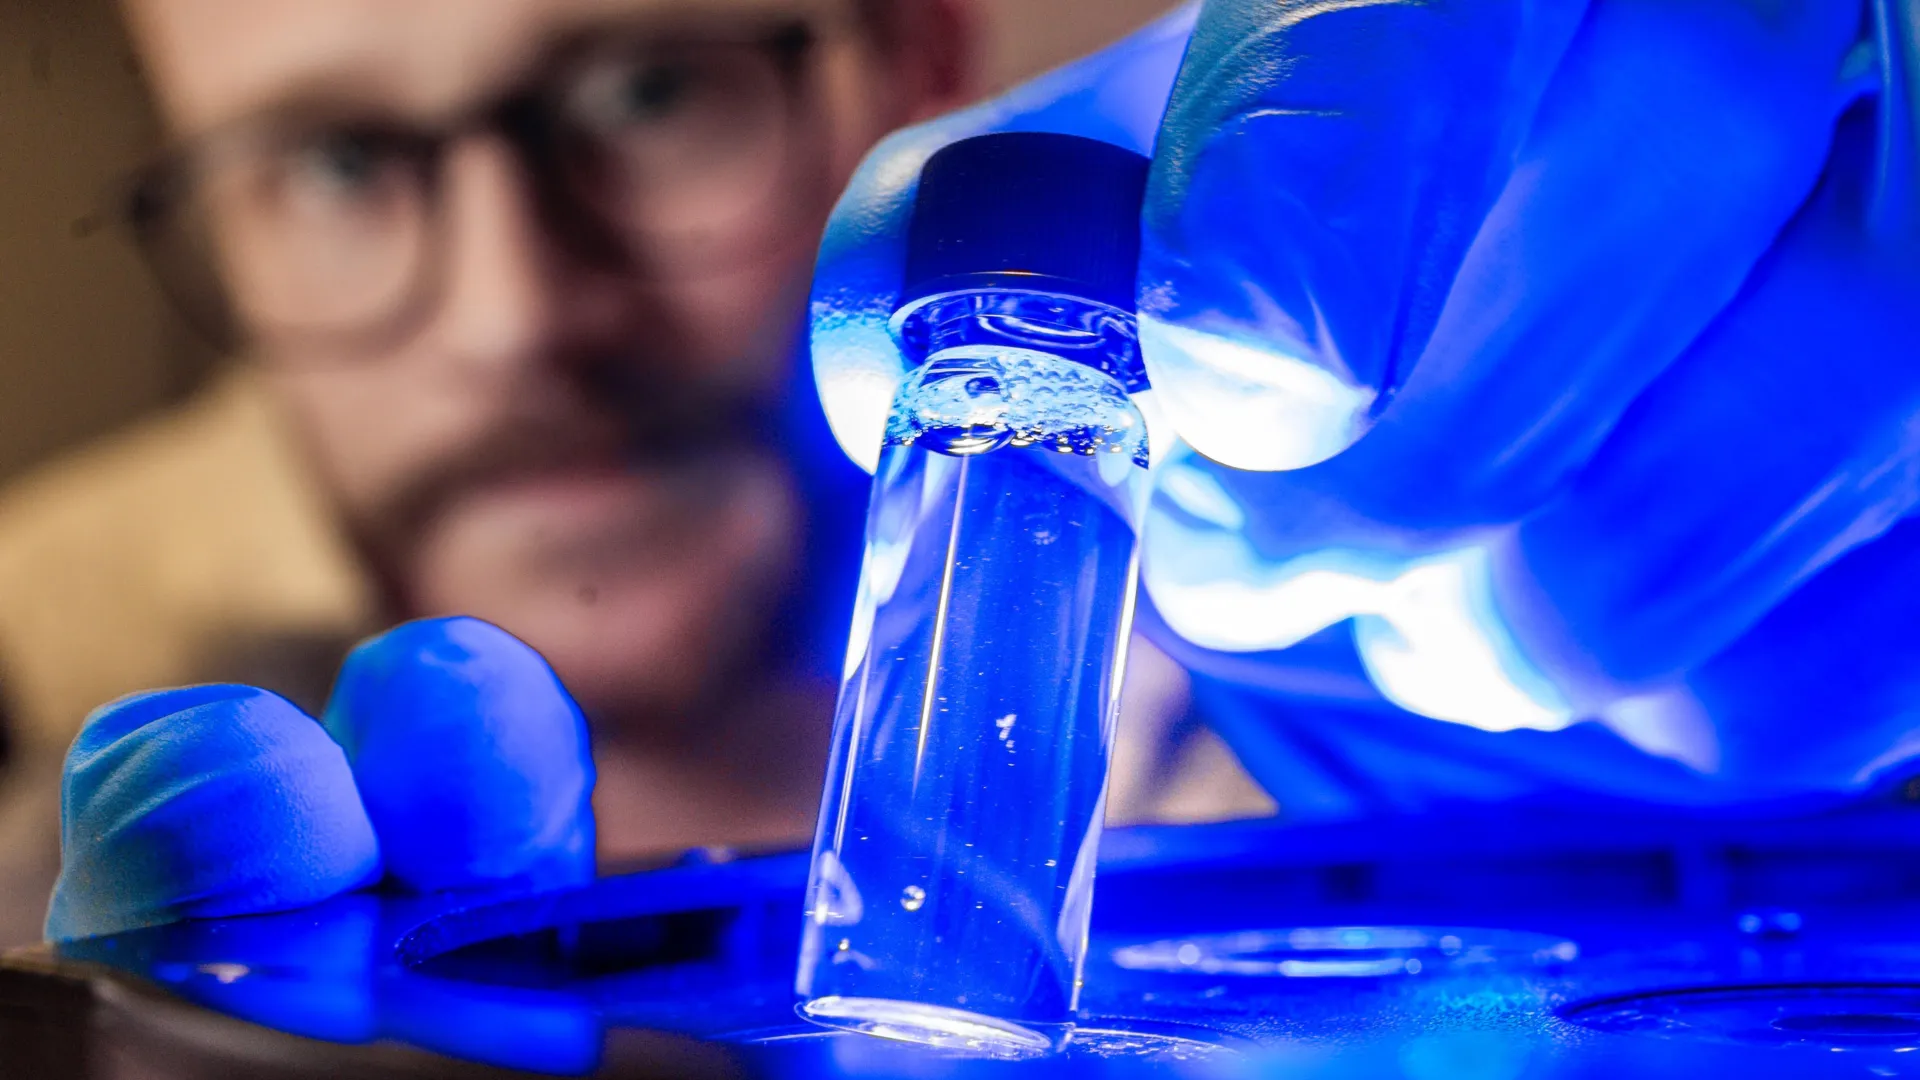
Light-printed electrodes turn skin and clothing into sensors
Researchers at Linköping and Lund universities in Sweden have demonstrated that visible light can be used to form electrodes from conductive plastics without the need for dangerous chemicals. Their results show that these electrodes can be…
Continue Reading
-
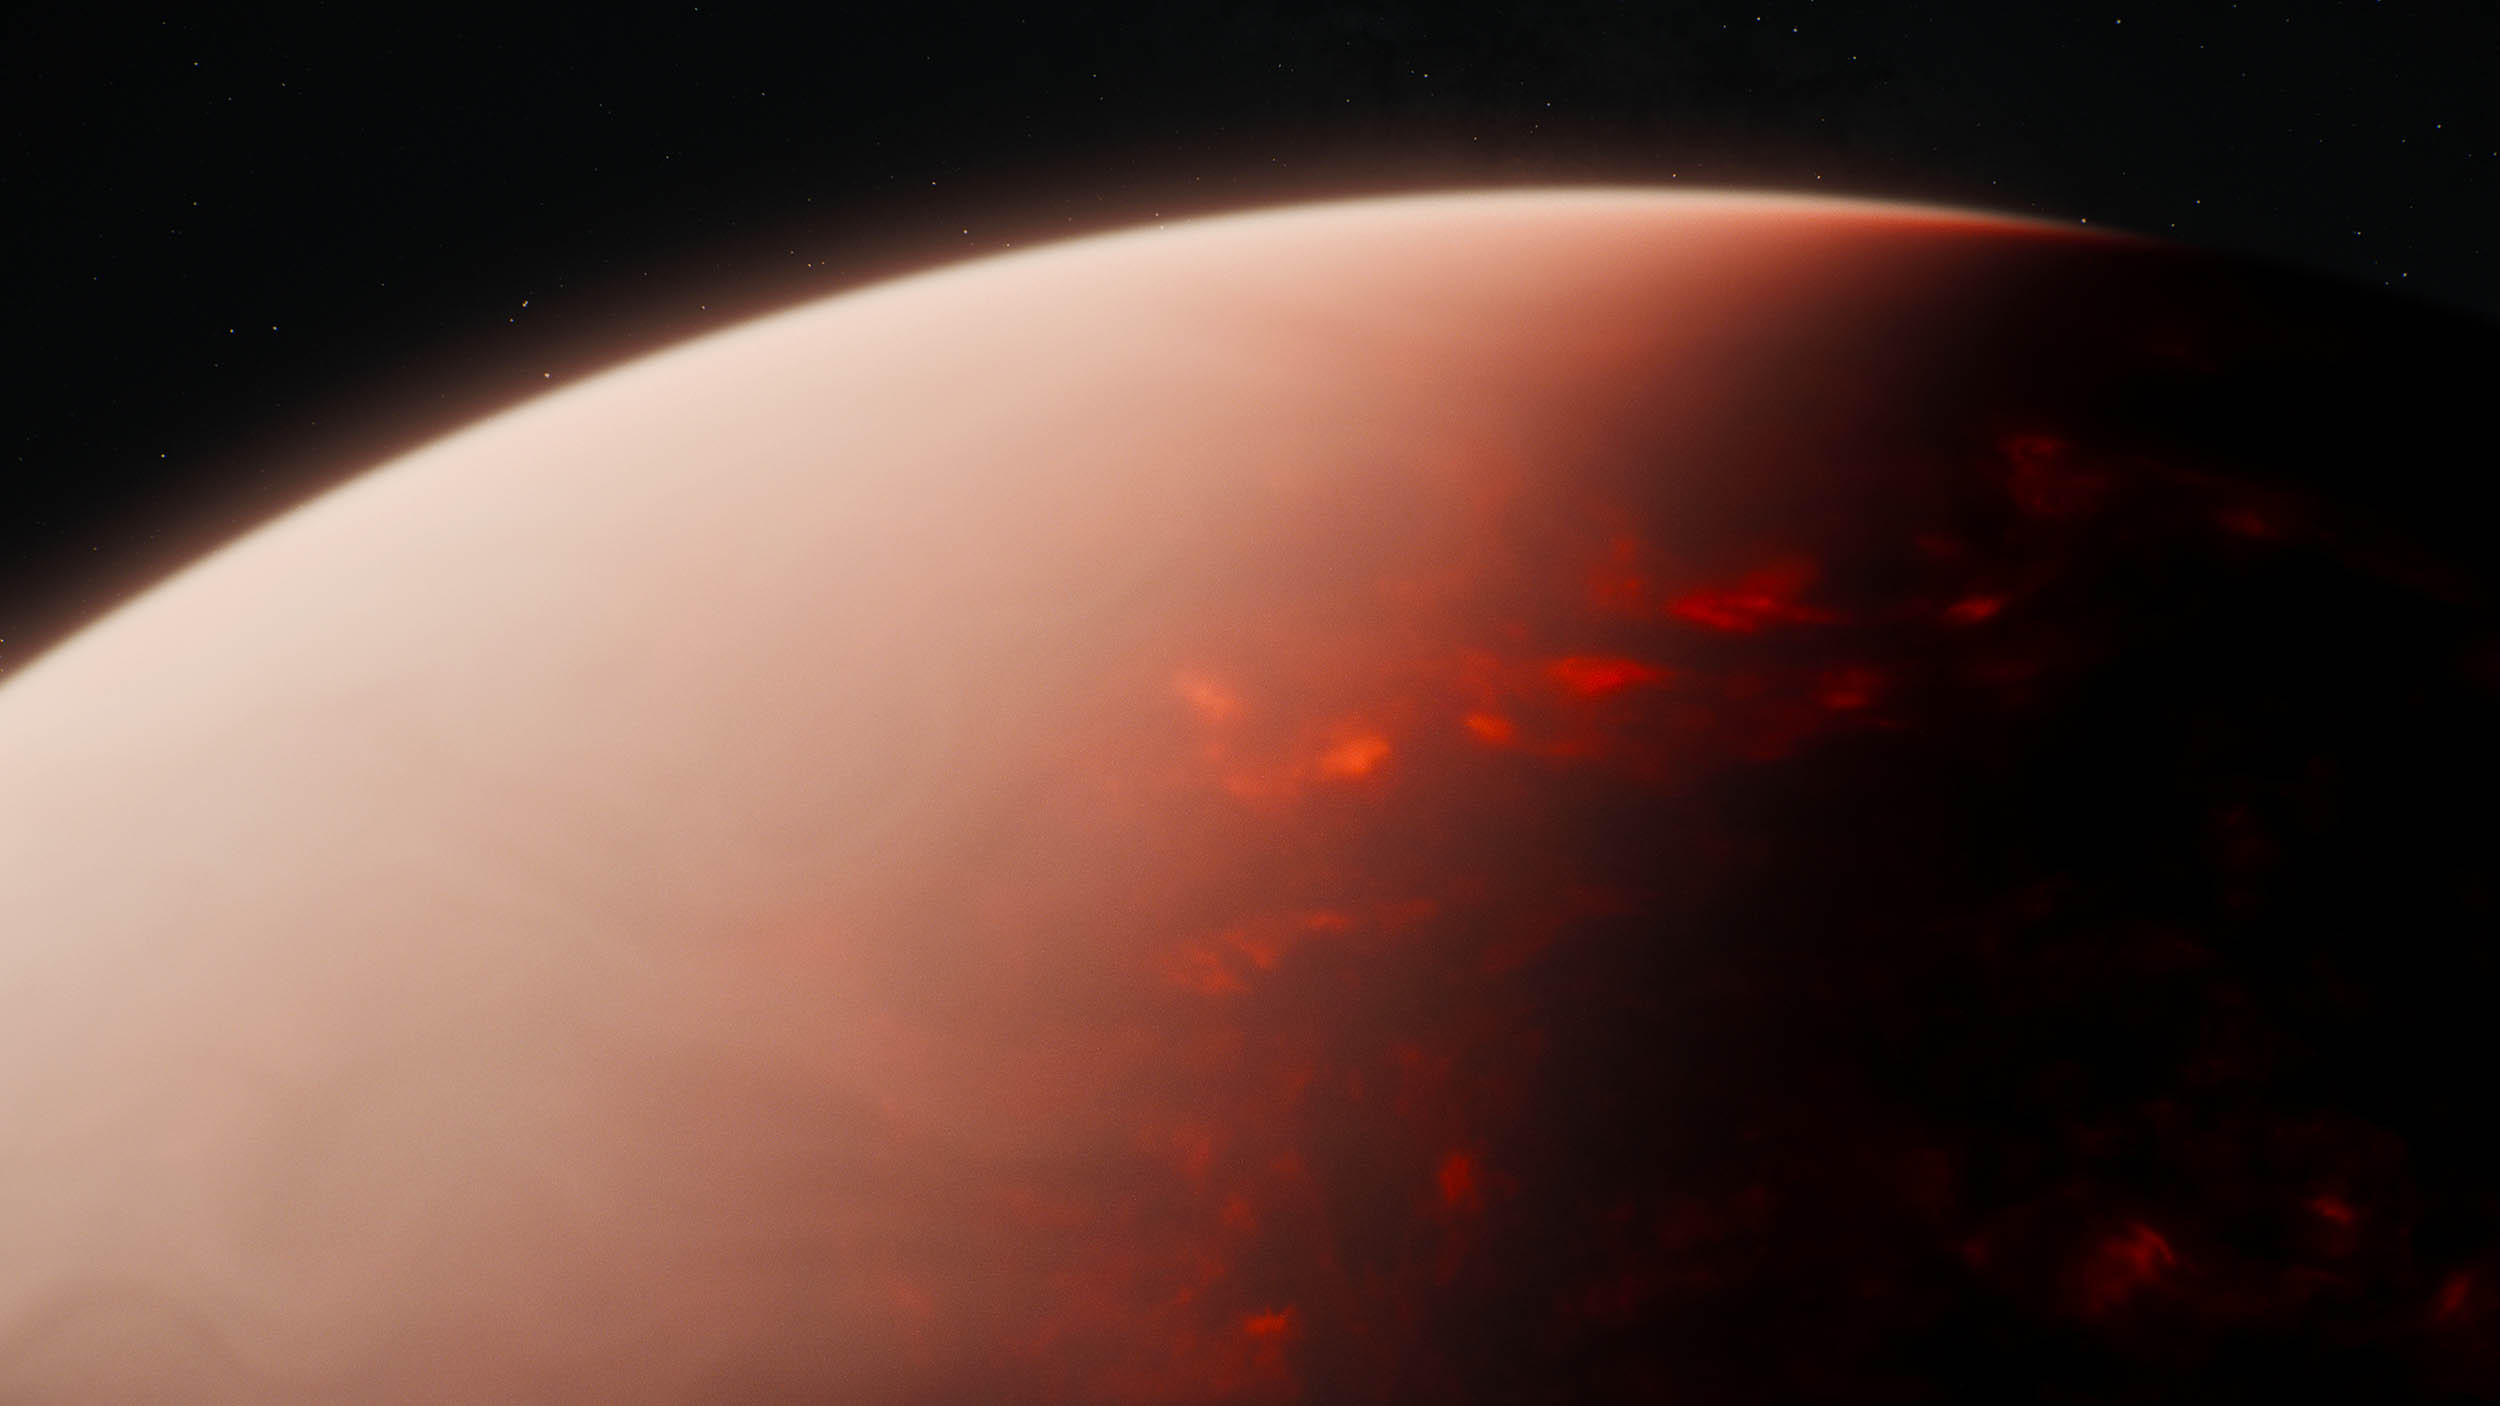
Webb reveals an atmosphere on a super-Earth that’s too hot for air
Astronomers using NASA’s James Webb Space Telescope (JWST) have spotted something few expected to see: a thick atmosphere clinging to a blisteringly hot rocky planet beyond our Solar System.
The world, called TOI-561 b, is an ultra-short-period…
Continue Reading
-
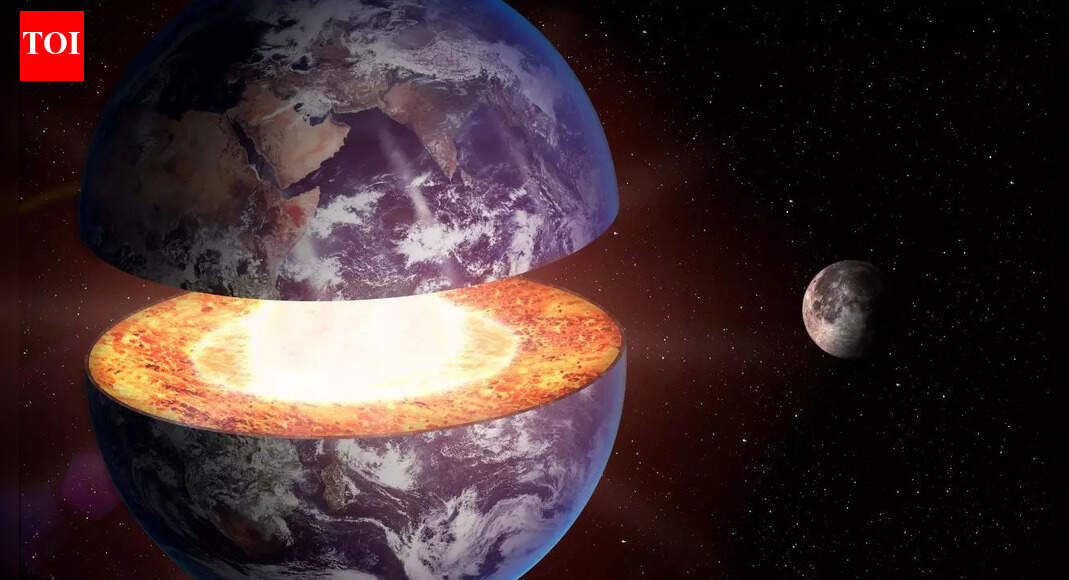
A massive hidden rock layer found under Bermuda is challenging Earth’s mantle theory |
Beneath the blue and coral reefs of Bermuda, a far different phenomenon has recently come to light. A geologic formation so unusual that it defies conventional wisdom concerning the formation of oceanic islands. Extending far beneath the ocean…
Continue Reading
-
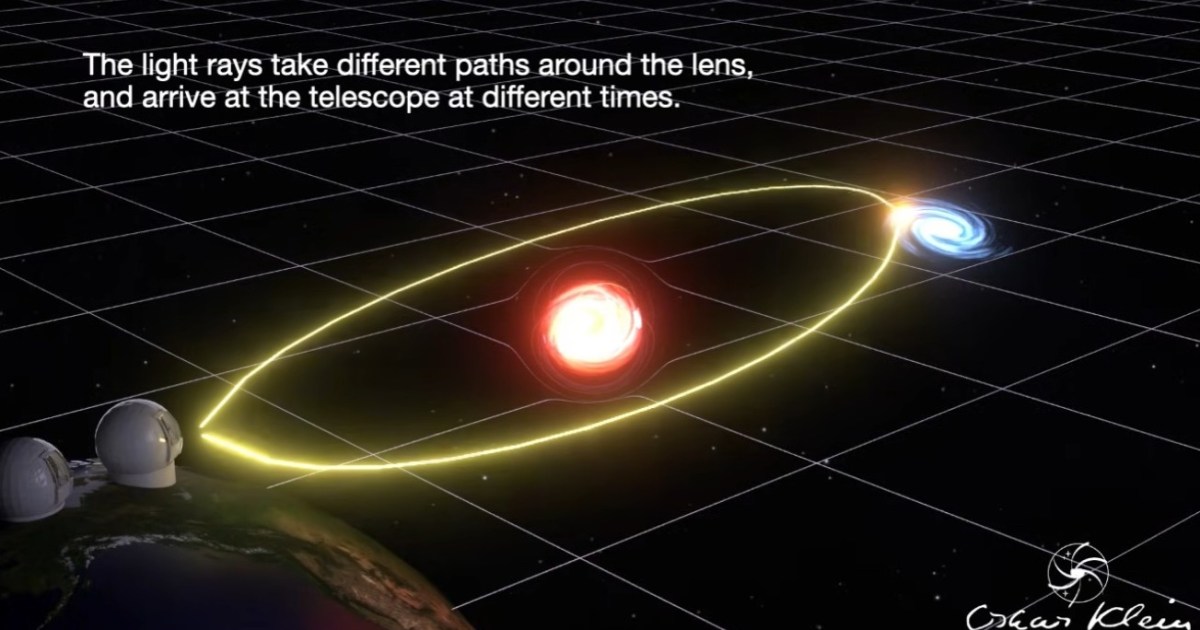
Brightest-ever lensed supernova reveals astronomy’s coming revolution
Sign up for the Starts With a Bang newsletter
Travel the universe with Dr. Ethan…
Continue Reading
-

Sewage discharged into Portland harbour after tug boat fault
Mr Reeves said: “It was discovered on 20 November that there was an issue with waste from the Maiden Castle tug being directed into the sea rather than its onboard containment tank.
“Portland Port takes this matter extremely seriously and action…
Continue Reading
-

SpaceX Falcon 9 launches 29 Starlink satellites into low Earth orbit from Florida
SpaceX launched 29 Starlink satellites from Florida early Monday morning (Dec. 14), beating the forecast for poor weather.
A Falcon 9 rocket lifted off at 12:25 a.m. EST (0525 GMT) from Space Launch Complex 40 (SLC-40) at the Cape Canaveral Space…
Continue Reading
-

Plants Survive Without Sun or Sex: Study Finds
Some plants lack both green pigments and sexual reproduction, yet these unusual traits reveal important insights into what defines plant life. A new study involving Kobe University examined species in the genus Balanophora to understand…
Continue Reading
-
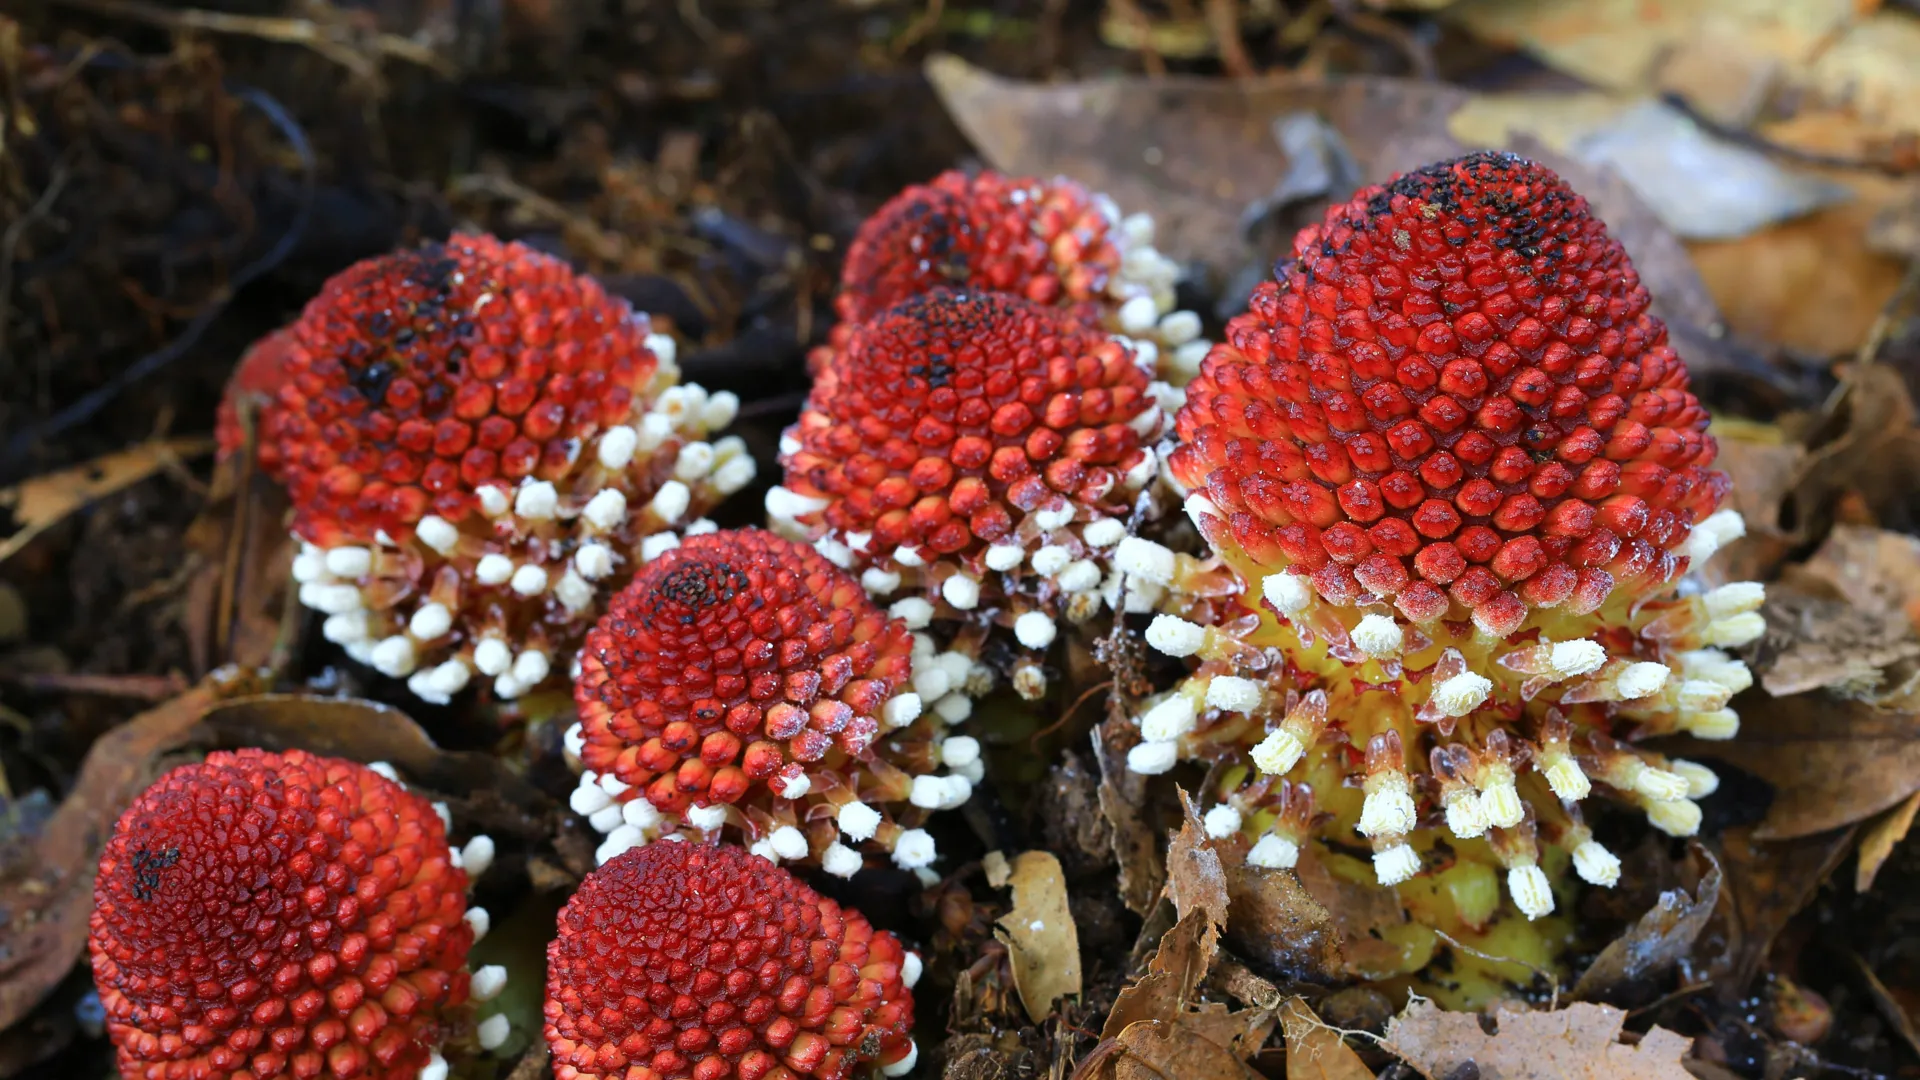
Researchers find how plants survive without sunlight or sex
Some plants lack both green pigments and sexual reproduction, yet these unusual traits reveal important insights into what defines plant life. A new study involving Kobe University examined species in the genus Balanophora to understand how…
Continue Reading