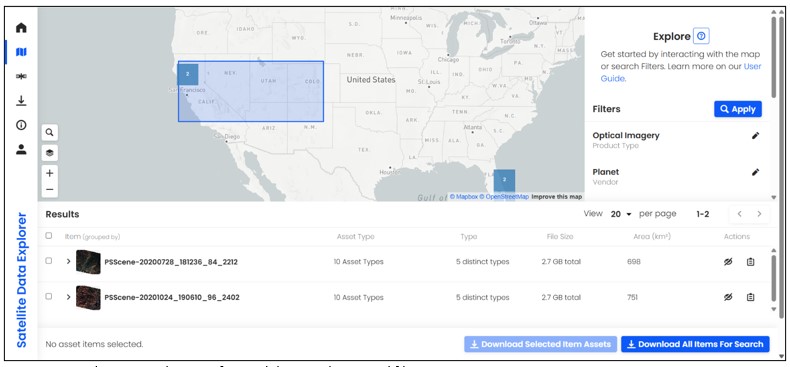
The Satellite Data Explorer (SDX) from NASA’s Commercial Satellite Data Acquisition (CSDA) program is a web-based data discovery and data access tool that allows approved users to search, discover, access, task, and download commercial Earth…
Category: 7. Science
-
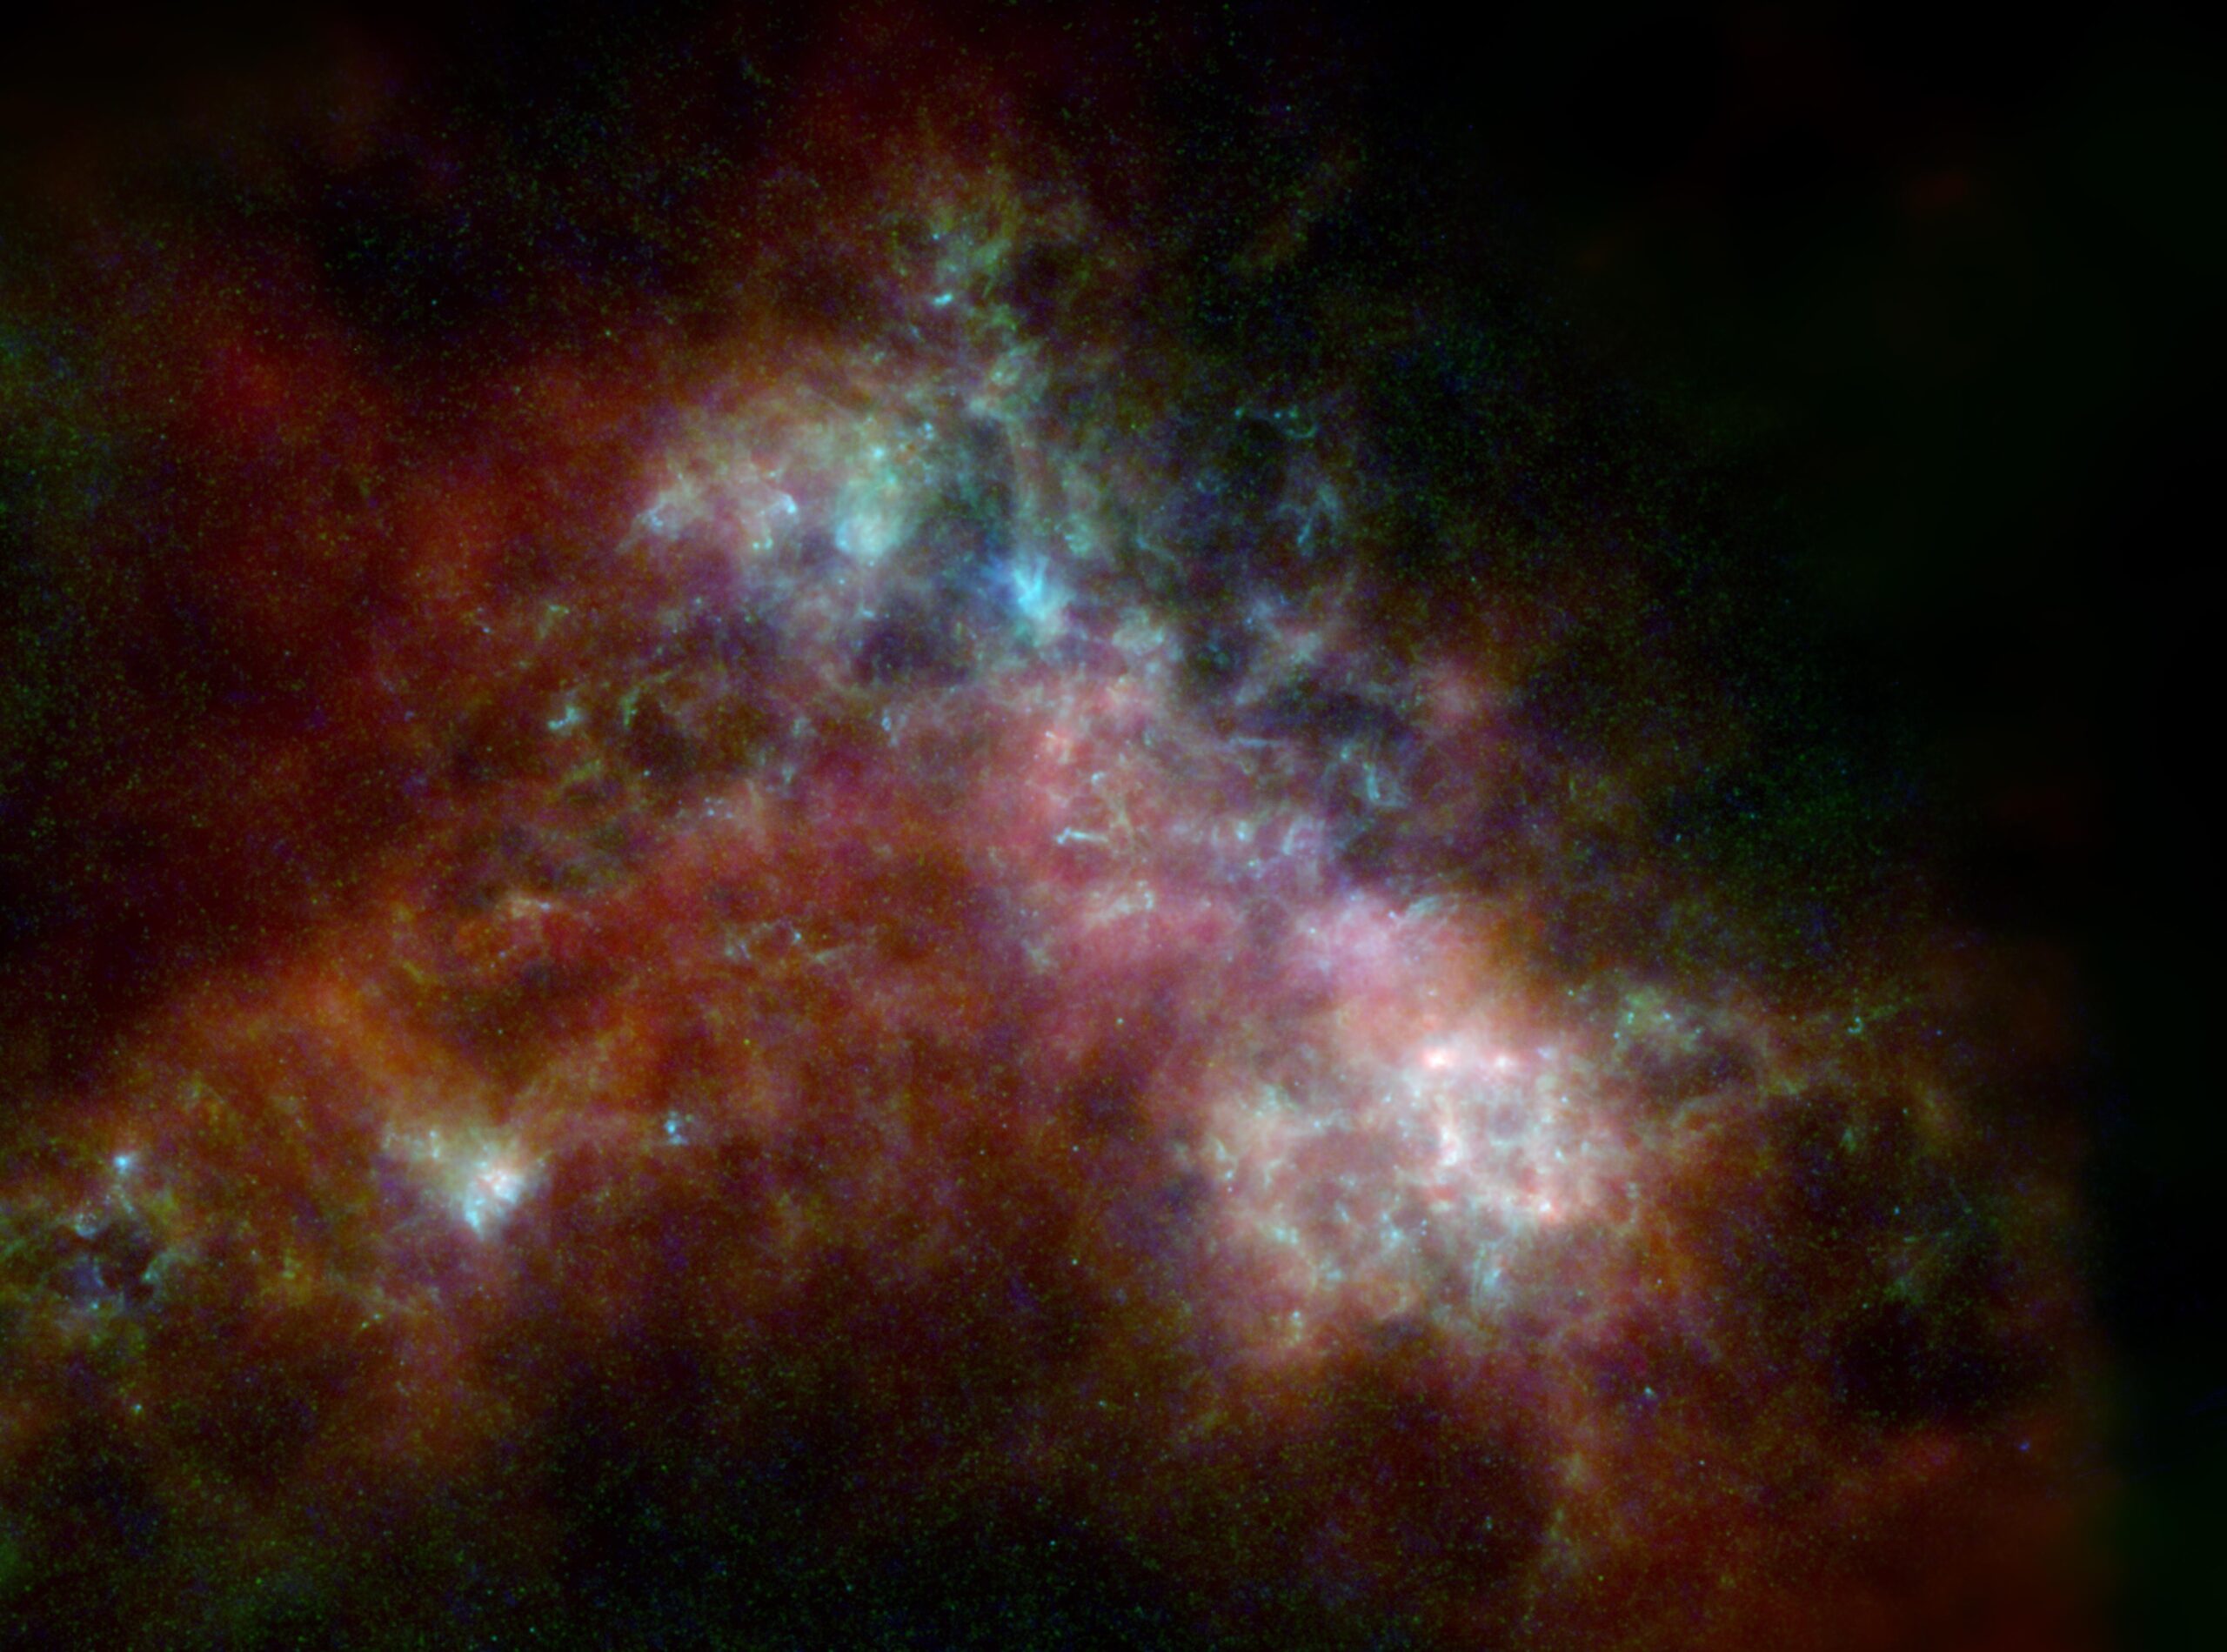
A galaxy next door is transforming, and astronomers can see it happening
The Small Magellanic Cloud, or the SMC, is one of the Milky Way’s closest galactic neighbors – a small, gas-rich galaxy visible to the naked eye from the southern hemisphere, bound to our galaxy by gravity, alongside its companion, the Large…
Continue Reading
-
ISS study identifies thresholds for muscle atrophy and fiber changes in reduced gravity – Phys.org
- ISS study identifies thresholds for muscle atrophy and fiber changes in reduced gravity Phys.org
- Do we have the muscle for Mars? – Rhody Today The University of Rhode Island
- 24 mice launched to orbit in 2023. What happened to their bodies could…
Continue Reading
-
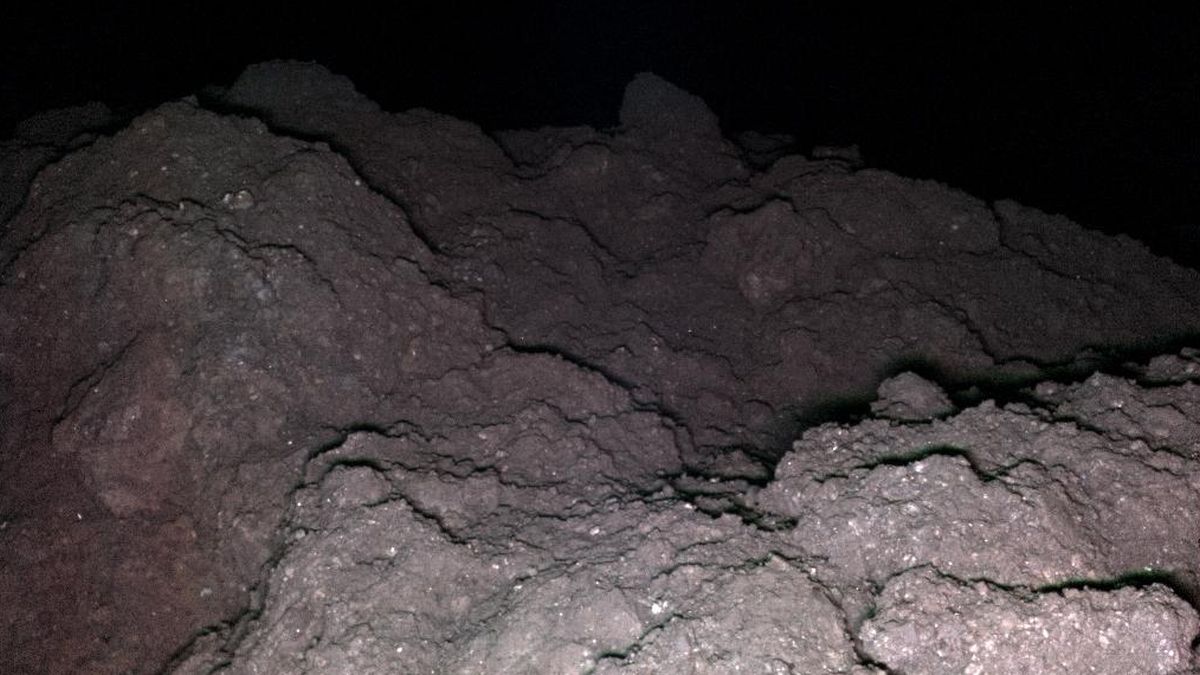
Asteroid Reveals The 5 Key Genetic Ingredients For Life on Earth
A new analysis of samples collected from asteroid Ryugu has yielded all five canonical nucleobases that make up RNA and DNA.
It’s not the first time all five have been isolated from asteroid material – asteroid Bennu also made the grade. But…
Continue Reading
-
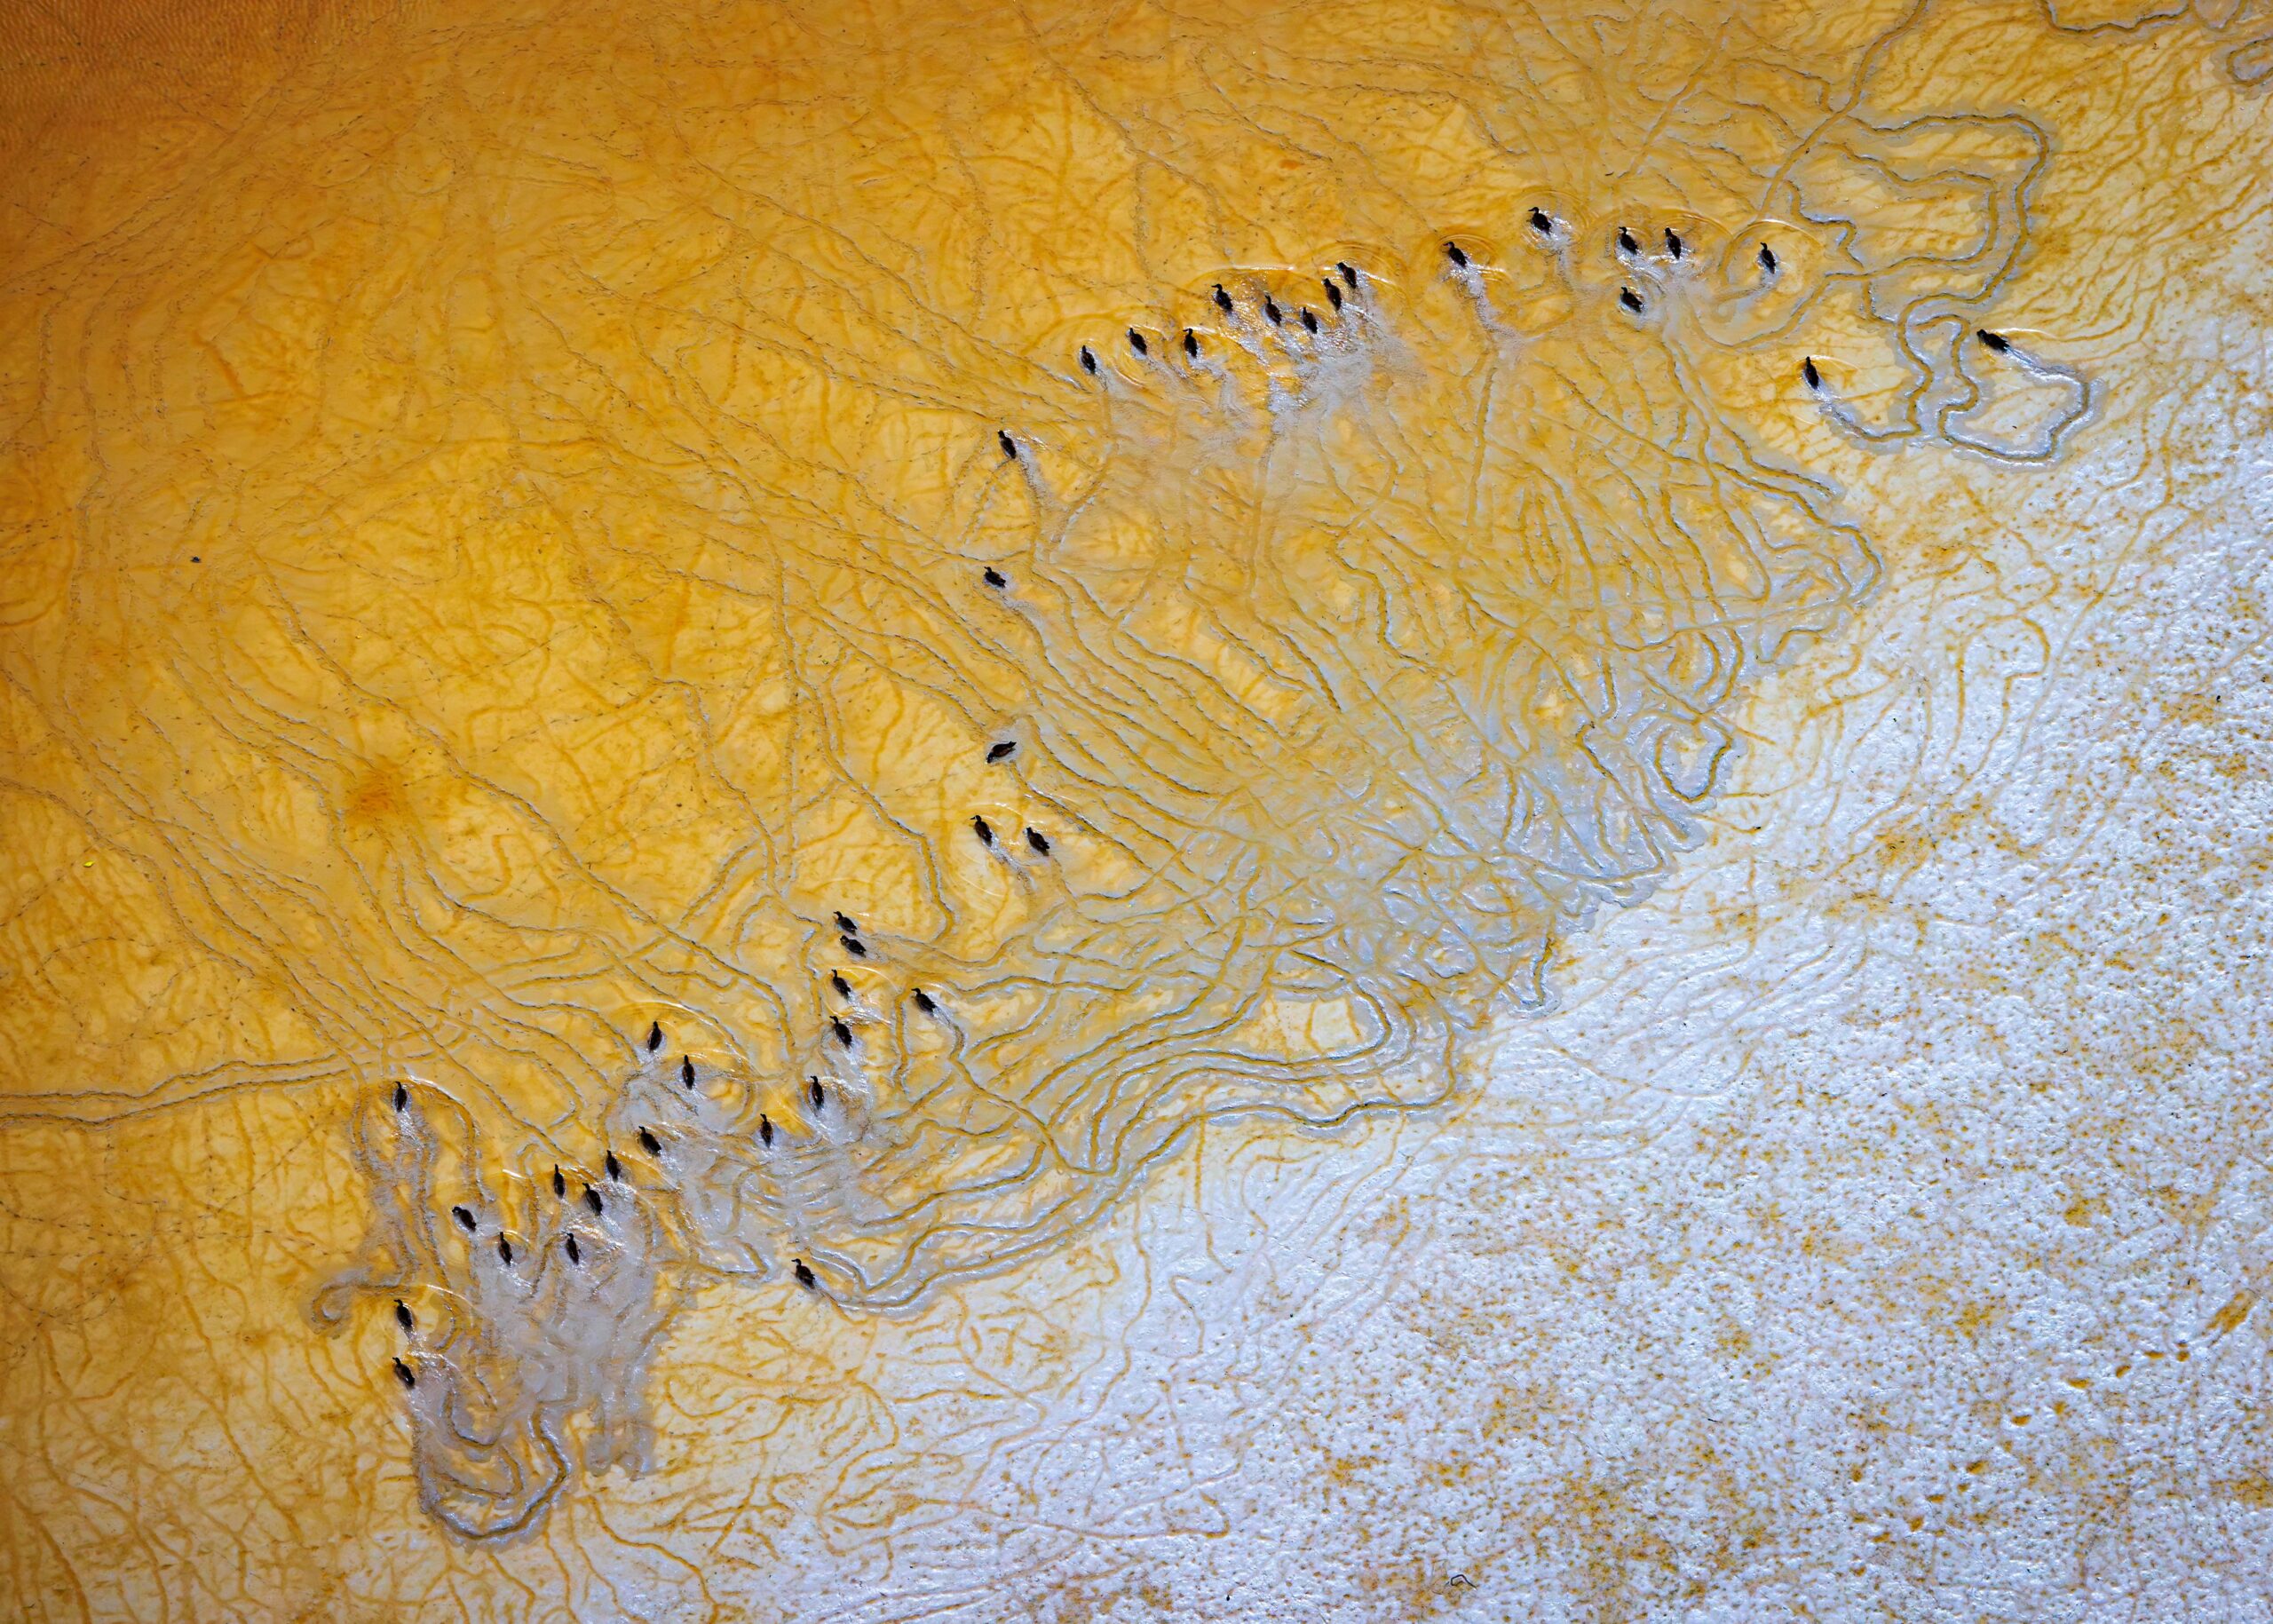
Unexpected role of seabird guano in shaping coastal landscapes
Beyond dune grasses, other plant species benefit from guano fertilisation. Annual herbaceous plants flourish in sandy soils, while richer soils support species such as sea couch and Atriplex in active breeding areas.
Continue Reading
Media Tip Sheet: NASA Satellite Returns to Earth After 14 Years – mediarelations.gwu.edu
- Media Tip Sheet: NASA Satellite Returns to Earth After 14 Years mediarelations.gwu.edu
- Incoming! 1,300-pound NASA satellite crashes back to Earth over eastern Pacific Ocean Space
- March 12: Van Allen Belt Probe Reentry Puts Space Debris Risk in…
Continue Reading
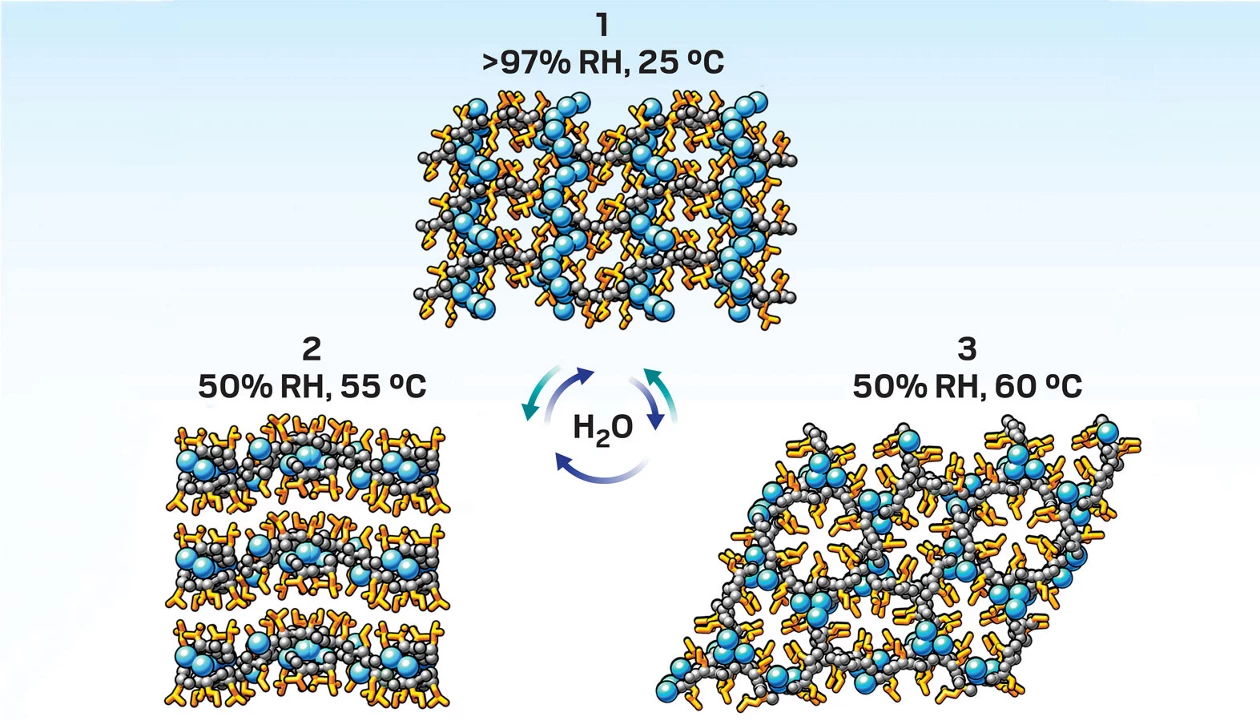
Light-Driven Reaction May Transform Drug Design
Scientists at the University of Cambridge have developed a new way to alter complex drug molecules using light rather than toxic chemicals – a discovery that could accelerate and improve how medicines are designed and…
Continue Reading
Magnaporthe oryzae MoPh1 perceives ER stress and promotes adaptive responses via a plasma membrane-to-vacuole pathway
Walter, P. & Ron, D. The unfolded protein response: from stress pathway to homeostatic regulation. Science 334, 1081–1086 (2011).
Hetz, C., Zhang, K. & Kaufman, R. J. Mechanisms, regulation…
Continue Reading

Shenzhou-21 astronauts complete second series of extravehicular activities-Xinhua
BEIJING, March 16 (Xinhua) — The Shenzhou-21 crew aboard China’s orbiting space station completed their mission’s second series of extravehicular activities (EVAs) on Monday, according to the China Manned Space Agency.
The astronaut trio — Zhang…
Continue Reading