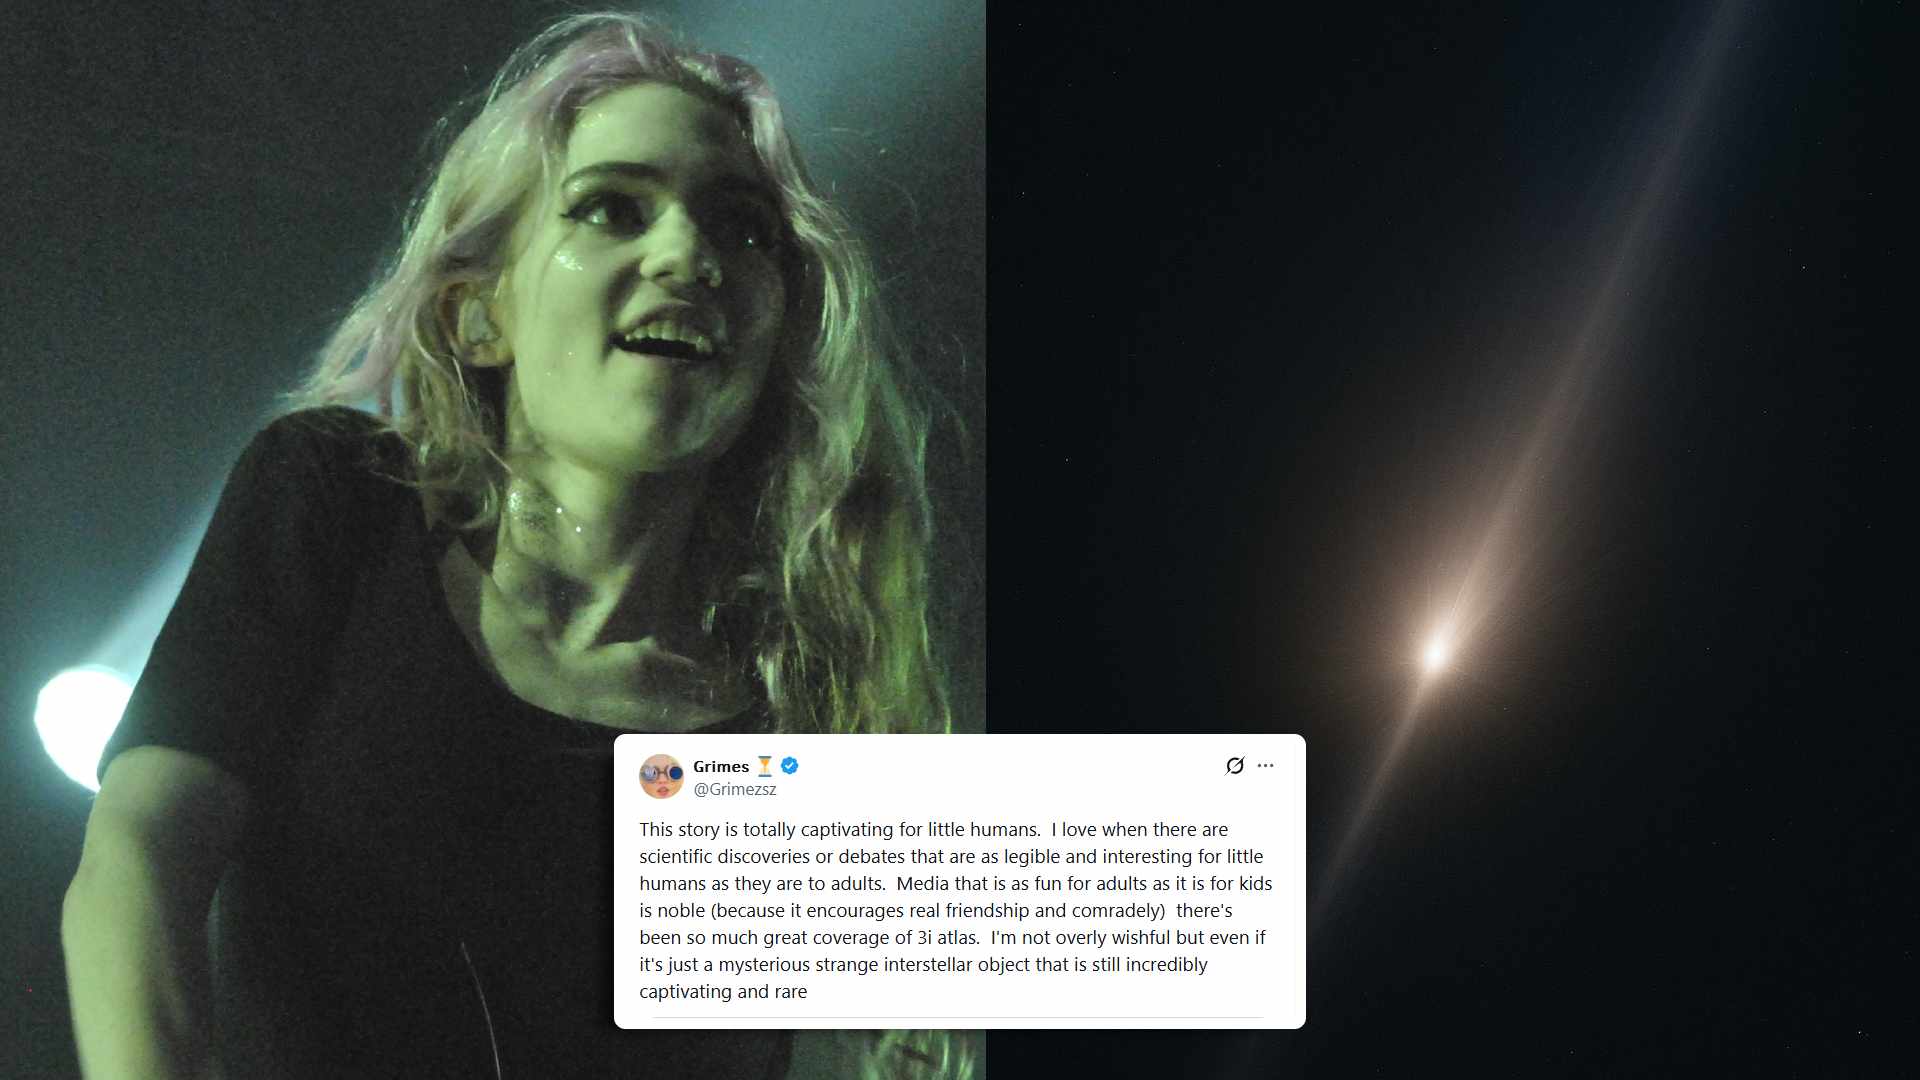
3I/ATLAS has generated much buzz and traffic on X/Twitter, among other social media platforms. However, it has also been a breeding ground for engagement farmers sharing AI-manipulated media, thereby toying with the fancies of lay, who…
Category: 7. Science
-

Space.com headlines crossword quiz for week of Nov. 24, 2025: The strange star Kepler-56 is classified as this type of star
Every week, Space.com delivers the latest discoveries, launches, and cosmic curiosities from across the universe. From groundbreaking research aboard the International Space Station to dazzling new images from the James Webb Space Telescope, the…
Continue Reading
-
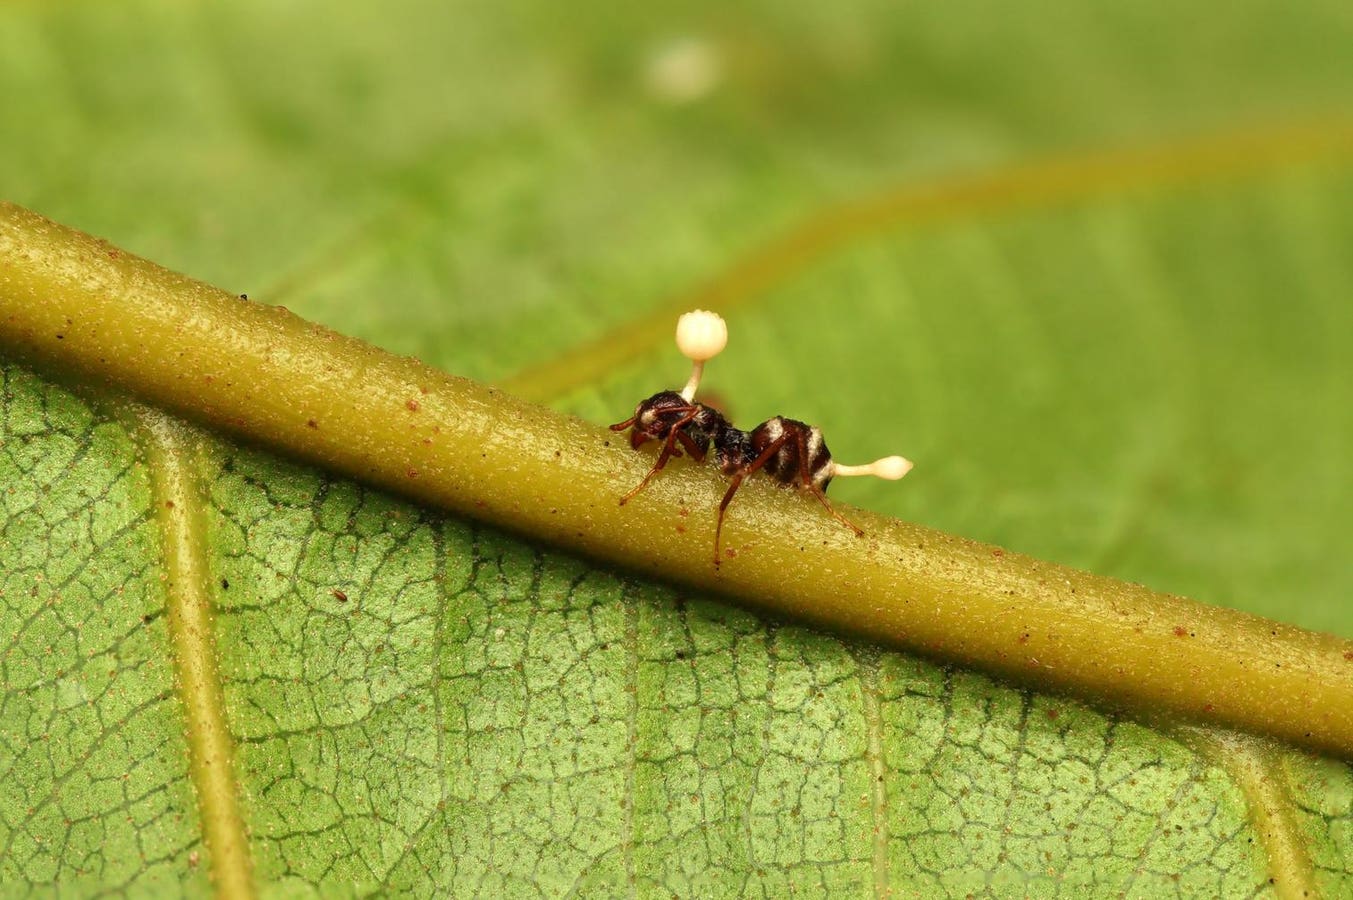
Meet The ‘Mind-Control Fungus’ That Turns Ants Into Zombies — A Biologist Explains
This microscopic, parasitic fungus evolved to hijack ants’ bodies. Here’s how it orchestrates their final moments with chilling evolutionary precision.
getty
The zombie apocalypse storyline of the popular video game and TV series The Last of Us…
Continue Reading
-

Scientists just teleported information using light
Life online remains vulnerable. Criminals can infiltrate bank accounts or steal personal identities, and AI is helping these attacks become more sophisticated. Quantum cryptography offers a promising defense by using the rules of quantum physics…
Continue Reading
-

Scientists pinpoint the force behind Venus’s extreme winds
Scientists have long struggled to explain why Venus’s atmosphere moves so quickly, with winds racing around the planet far faster than its own rotation.
Now, new research suggests that a daily thermal tide created by solar heating is the main…
Continue Reading
-
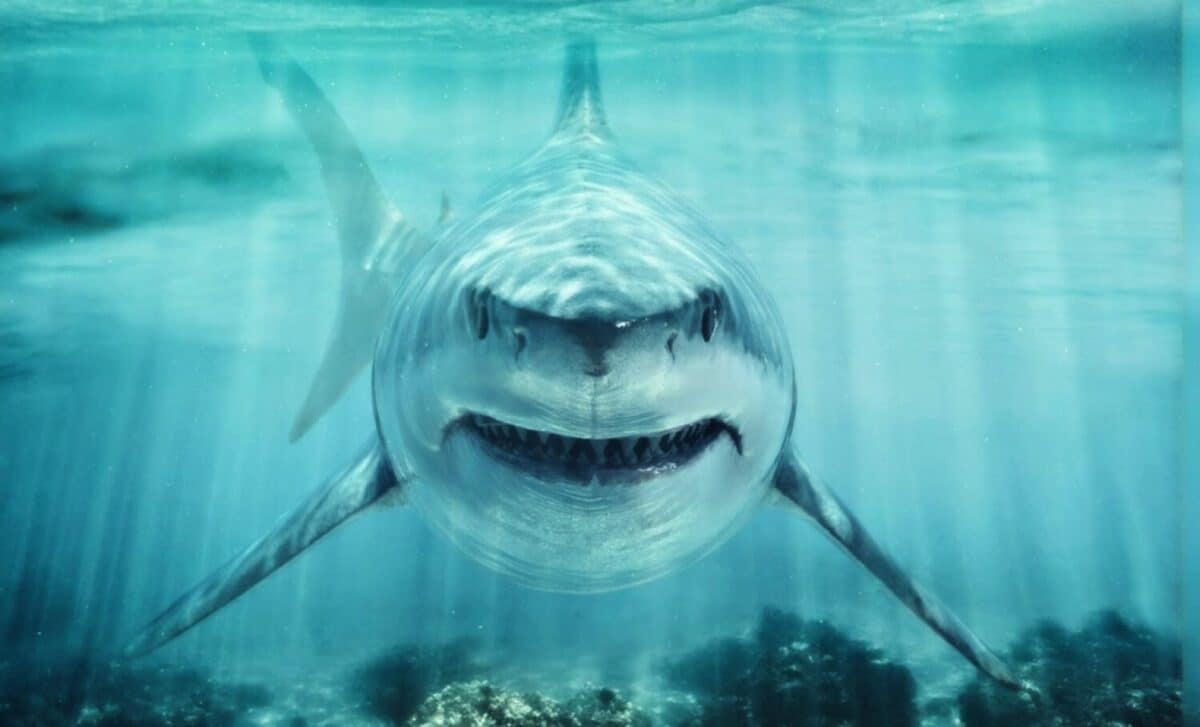
Scientists Unearthed an Enormous Shark Fossil That Dominated Oceans in Dinosaur Times
Around 115 million years ago, the waters off northern Australia were home to a giant shark that totally flips what we thought we knew about ancient ocean predators. Recent fossil discoveries show that sharks reached enormous sizes much…
Continue Reading
-
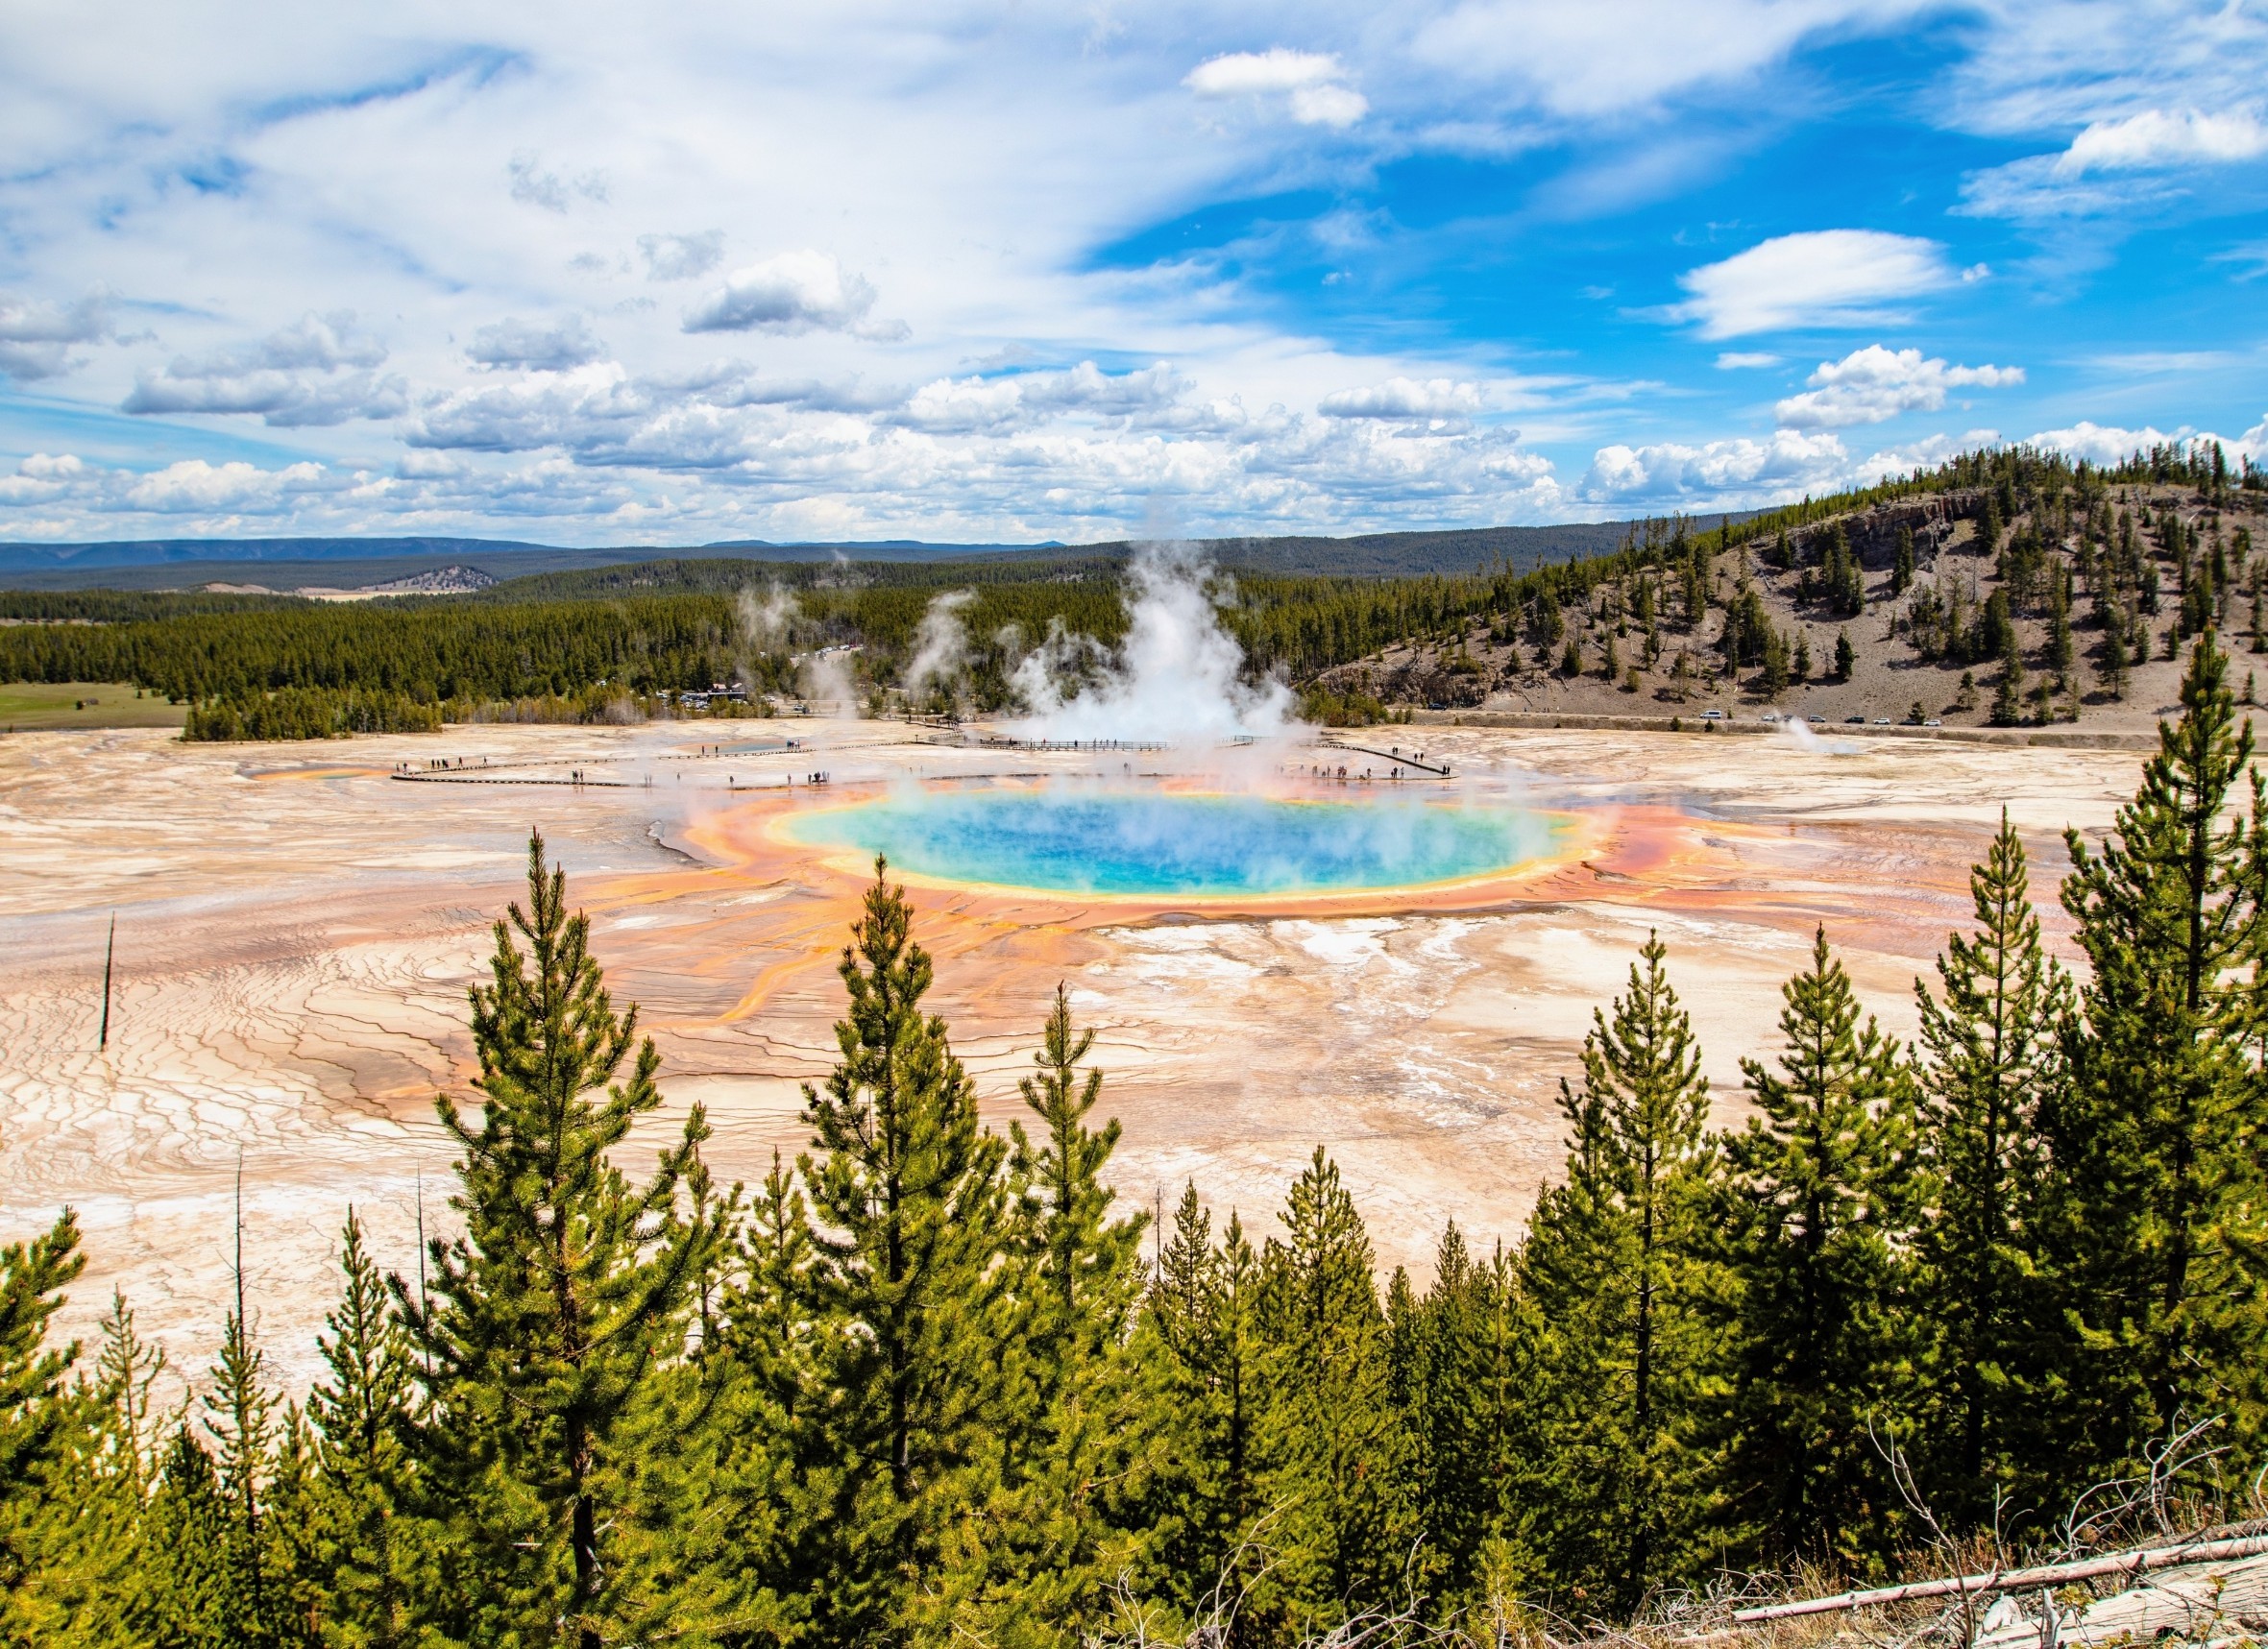
Small quakes wake up deep life under Yellowstone
In 2021, a swarm of small earthquakes rippled beneath Yellowstone National Park and jolted a hidden ecosystem nearly 325 feet below the surface. Microbes living in a buried pocket of groundwater suddenly got a burst of energy.
A new study of…
Continue Reading
-
JWST spots a strange red dot so extreme scientists can’t explain it
In the summer of 2022, only a few weeks after the James Webb Space Telescope (JWST) began delivering its first scientific images, astronomers noticed an unexpected pattern: tiny red points scattered throughout the new observations. These…
Continue Reading
-
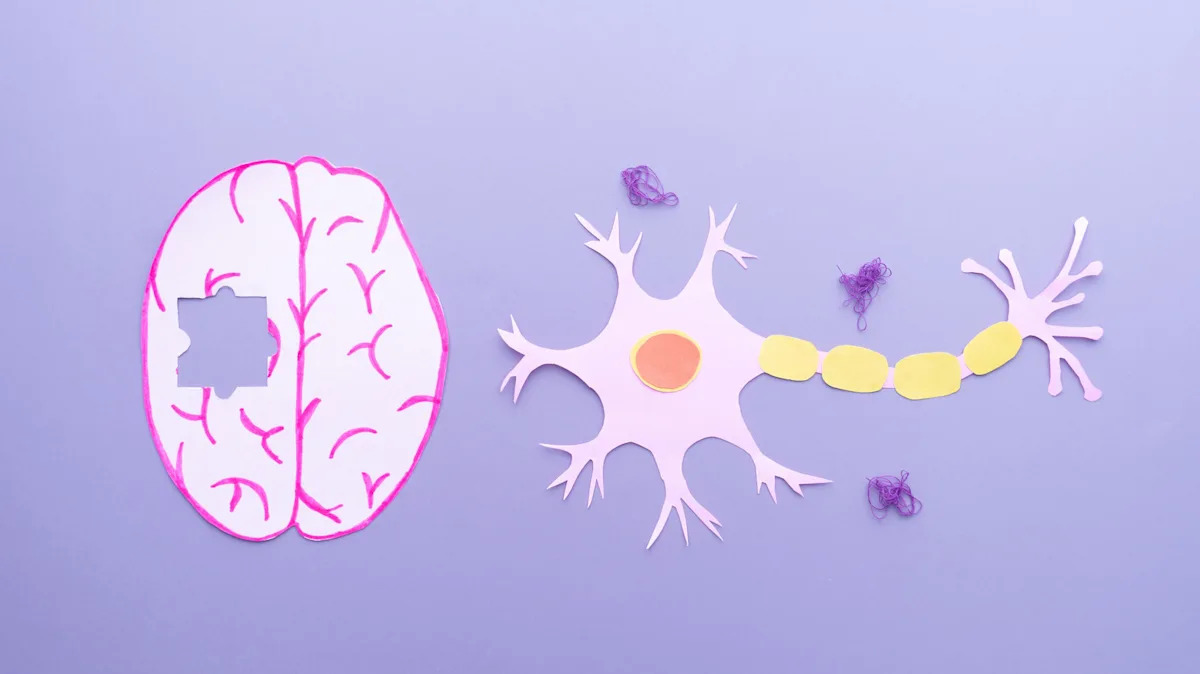
This Nanotechnology Discovery Is Reversing Alzheimer’s In Mice
Scientists may have just taken a major step toward reversing Alzheimer’s disease, at least in mice. A new study led by researchers at the Institute for Bioengineering of Catalonia (IBEC) and West China Hospital Sichuan University describes a…
Continue Reading