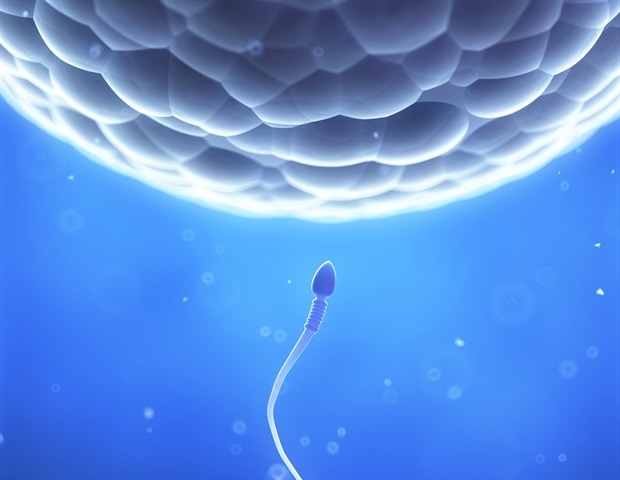
Category: 7. Science

  • Chemicals in Plastics: Paths to Safer Polymers

    Chemicals in Plastics: Paths to Safer Polymers

    Plastics are everywhere, and the chemicals they contain are a core issue: All plastics, from food packaging to car tires, contain hundreds of chemicals that can leach into foodstuffs, homes, and the environment. Many of these are known to harm the health of humans and the environment. However, a comprehensive overview of these chemicals is currently missing, which limits society’s ability to protect people and planet from hazardous plastic chemicals. “Plastics should not contain harmful chemicals to begin with. Yet, the scientific evidence shows that they are intentionally used or unintentionally present in all types of plastics”, says Martin Wagner, a lead author of the study and Professor at the Norwegian University of Science and Technology (NTNU) in Trondheim. “This underpins the urgent need to make plastics safer.”

    The global «plastosphere» contains more than 16,000 chemicals

    The new study by an international team of researchers with participation of Empa and Eawag shows: There are more chemicals in plastics than was previously known, with 16,325 chemicals included in the PlastChem database ( https://plastchem-project.org/ ) that accompanies the work. Importantly, the scientists discovered at least 4,200 plastic chemicals that are of concern because of the hazards they pose to health and the environment. “It may seem daunting to address the large number of problematic plastic chemicals, but the study provides the tools to do so”, says Zhanyun Wang, co-author of the study and a scientist at Empa. “Importantly, simplifying chemical compositions is a prerequisite for advancing towards a safe and sustainable circular economy for plastics.”

    These chemicals of concern can be present in each major plastic type, including food packaging, and all tested plastics can release hazardous chemicals. As Ksenia Groh, co-author and Group Leader in Bioanalytics at Eawag puts it: “Plastics can contain and leach unknown substances, such as contaminants, impurities or degradation products. The toxicity of chemicals leaching from plastics can be evaluated using bioassays, a practical alternative to chemical analytics. This promising approach needs further development for broader application in the future.”

    Pathways to safer and more sustainable polymers

    The new study outlines three major pathways towards safer and more sustainable plastics: safer chemicals, transparency, and chemically simpler plastics. Known chemicals of concern should be removed from plastics, either by voluntary industry action or regulation. More transparency is needed, given that industry currently does not disclose which chemicals are present in which plastic product. Finally, plastics should be re-designed to contain fewer chemicals that are thoroughly assessed for their safety, particularly if they are to be reused or recycled. “There is a lot of momentum to make plastics safer. Our study provides the scientific evidence needed to achieve that goal and to better protect human health and the environment from chemicals of concern in plastics”, says Laura Monclús, another lead author of the study and researcher at the Norwegian Geotechnical Institute (NGI) in Trondheim.

    /Public Release. This material from the originating organization/author(s) might be of the point-in-time nature, and edited for clarity, style and length. Mirage.News does not take institutional positions or sides, and all views, positions, and conclusions expressed herein are solely those of the author(s).View in full here.

    Continue Reading

  • NASA’s Webb Scratches Beyond Surface of Cat’s Paw for 3rd Anniversary

    NASA’s Webb Scratches Beyond Surface of Cat’s Paw for 3rd Anniversary

    It’s the cat’s meow! To celebrate its third year of revealing stunning scenes of the cosmos in infrared light, NASA’s James Webb Space Telescope has “clawed” back the thick, dusty layers of a section within the Cat’s Paw Nebula (NGC 6334). Focusing Webb’s NIRCam (Near-Infrared Camera) on a single “toe bean” within this active star-forming region revealed a subset of mini toe beans, which appear to contain young stars shaping the surrounding gas and dust.

    Webb’s look at this particular area of the Cat’s Paw Nebula just scratches the surface of the telescope’s three years of groundbreaking science.

    “Three years into its mission, Webb continues to deliver on its design – revealing previously hidden aspects of the universe, from the star formation process to some of the earliest galaxies,” said Shawn Domagal-Goldman, acting director of the Astrophysics Division at NASA Headquarters in Washington. “As it repeatedly breaks its own records, Webb is also uncovering unknowns for new generations of flagship missions to tackle. Whether it’s following up on the mysteries of dark matter with NASA’s nearly complete Nancy Grace Roman Space Telescope, or narrowing our search for life to Earth-like planets with the Habitable Worlds Observatory, the questions Webb has raised are just as exciting as the answers it’s giving us.”

    The progression from a large molecular cloud to massive stars entails multiple steps, some of which are still not well understood by astronomers. Located approximately 4,000 light-years away in the constellation Scorpius, the Cat’s Paw Nebula offers scientists the opportunity to study the turbulent cloud-to-star process in great detail. Webb’s observation of the nebula in near-infrared light builds upon previous studies by NASA’s Hubble and retired Spitzer Space Telescope in visible- and infrared-light, respectively.

    With its sharp resolution, Webb shows never-before-seen structural details and features: Massive young stars are carving away at nearby gas and dust, while their bright starlight is producing a bright nebulous glow represented in blue. It’s a temporary scene where the disruptive young stars, with their relatively short lives and luminosity, have a brief but important role in the region’s larger story. As a consequence of these massive stars’ lively behavior, the local star formation process will eventually come to a stop.

    Start with the toe bean at top center, which is nicknamed the “Opera House” for its circular, tiered-like structure. The primary drivers for the area’s cloudy blue glow are most likely toward its bottom: either the light from the bright yellowish stars or from a nearby source still hidden behind the dense, dark brown dust.

    Just below the orange-brown tiers of dust is a bright yellow star with diffraction spikes. While this massive star has carved away at its immediate surroundings, it has been unable to push the gas and dust away to greater distances, creating a compact shell of surrounding material.

    Look closely to notice small patches, like the tuning fork-shaped area to the Opera House’s immediate left, that contain fewer stars. These seemingly vacant zones indicate the presence of dense foreground filaments of dust that are home to still-forming stars and block the light of stars in the background.

    Toward the image’s center are small, fiery red clumps scattered amongst the brown dust. These glowing red sources mark regions where massive star formation is underway, albeit in an obscured manner.

    Some massive blue-white stars, like the one in the lower left toe bean, seem to be more sharply resolved than others. This is because any intervening material between the star and the telescope has been dissipated by stellar radiation.

    Near the bottom of that toe bean are small, dense filaments of dust. These tiny clumps of dust have managed to remain despite the intense radiation, suggesting that they are dense enough to form protostars. A small section of yellow at the right notes the location of a still-enshrouded massive star that has managed to shine through intervening material.

    Across this entire scene are many small yellow stars with diffraction spikes. Bright blue-white stars are in the foreground of this Webb image, but some may be a part of the more expansive Cat’s Paw Nebula area.

    One eye-catching aspect of this Webb image is the bright, red-orange oval at top right. Its low count of background stars implies it is a dense area just beginning its star-formation process. A couple of visible and still-veiled stars are scattered throughout this region, which are contributing to the illumination of the material in the middle. Some still-enveloped stars leave hints of their presence, like a bow shock at the bottom left, which indicates an energetic ejection of gas and dust from a bright source.

    Further explore this subset of toe beans by embarking on a narrated tour or getting closer to the image. We also invite you to reminisce about Webb’s three years of science observations.

    This visualization explores a subset of toe bean-reminiscent structures within a section of the Cat’s Paw Nebula, a massive, local star-forming region located approximately 4,000 light-years away in the constellation Scorpius.

    This image by NASA’s James Webb Space Telescope in near-infrared light was released in honor of the telescope’s third science operations anniversary. Since it began science operations in July 2022, Webb’s observations of our universe have wowed scientists and the public alike.

    Glide into the lower left toe bean, moving past many small yellow stars along the way, where filaments of gas and dust frame the cavernous area. The region’s nebulous glow, represented in blue, is from the bright light of massive young stars.

    Float toward the top toe bean, which is nicknamed the “Opera House” for its circular, tiered-like structure. As you move, you’ll pass plumes of orange-brown dust that vary in density and small, fiery red clumps where star formation is occurring, albeit in an obscured manner.

    Credits: Producers: Greg Bacon (STScI), Frank Summers (STScI); Image Processing: Joe DePasquale (STScI); Music: Joe DePasquale (STScI); Designers: Ralf Crawford (STScI), Leah Hustak (STScI), Christian Nieves (STScI), Alyssa Pagan (STScI); Images: NASA, ESA, CSA, STScI; ESO/VISTA.

    This zoom-in video shows the location of the Cat’s Paw Nebula on the sky. It begins with a ground-based photo by the late astrophotographer Akira Fujii, then shows views from the Digitized Sky Survey. The video then hones in on a select portion of the sky to reveal a European Southern Observatory image of the Cat’s Paw Nebula in visible light. The video continues to zoom in on a section of the Cat’s Paw, which gradually transitions to the stunning image captured by NASA’s James Webb Space Telescope in near-infrared light.
     
    Credits: Video: NASA, ESA, CSA, Danielle Kirshenblat (STScI); Acknowledgement: Akira Fujii, DSS, VISTA.

    The James Webb Space Telescope is the world’s premier space science observatory. Webb is solving mysteries in our solar system, looking beyond to distant worlds around other stars, and probing the mysterious structures and origins of our universe and our place in it. Webb is an international program led by NASA with its partners, ESA (European Space Agency) and CSA (Canadian Space Agency).

    To learn more about Webb, visit:

    https://science.nasa.gov/webb

    Downloads

    Click any image to open a larger version.

    View/Download all image products at all resolutions for this article from the Space Telescope Science Institute.

    Laura Betz – laura.e.betz@nasa.gov
    NASA’s Goddard Space Flight Center, Greenbelt, Md.

    Abigail Major – amajor@stsci.edu
    Space Telescope Science Institute, Baltimore, Md.

    Hannah Braun – hbraun@stsci.edu
    Space Telescope Science Institute, Baltimore, Md.

    View other images of the Cat’s Paw Nebula

    Animation Video: “How Dense Pillars Form in Molecular Clouds”

    Explore a larger view of the Cat’s Paw Nebula: ViewSpace Video

    Read more: Webb Star Formation Discoveries

    More Webb News

    More Webb Images

    Webb Science Themes

    Webb Mission Page

    What is the Webb Telescope?

    SpacePlace for Kids

    En Español

    Este artículo en español

    Ciencia de la NASA

    NASA en español 

    Space Place para niños

    Continue Reading

  • NASA’s Webb Scratches Beyond Surface of Cat’s Paw for 3rd Anniversary

    NASA’s Webb Scratches Beyond Surface of Cat’s Paw for 3rd Anniversary

    It’s the cat’s meow! To celebrate its third year of revealing stunning scenes of the cosmos in infrared light, NASA’s James Webb Space Telescope has “clawed” back the thick, dusty layers of a section within the Cat’s Paw Nebula (NGC 6334). Focusing Webb’s NIRCam (Near-Infrared Camera) on a single “toe bean” within this active star-forming region revealed a subset of mini toe beans, which appear to contain young stars shaping the surrounding gas and dust.

    Webb’s look at this particular area of the Cat’s Paw Nebula just scratches the surface of the telescope’s three years of groundbreaking science.

    “Three years into its mission, Webb continues to deliver on its design – revealing previously hidden aspects of the universe, from the star formation process to some of the earliest galaxies,” said Shawn Domagal-Goldman, acting director of the Astrophysics Division at NASA Headquarters in Washington. “As it repeatedly breaks its own records, Webb is also uncovering unknowns for new generations of flagship missions to tackle. Whether it’s following up on the mysteries of dark matter with NASA’s nearly complete Nancy Grace Roman Space Telescope, or narrowing our search for life to Earth-like planets with the Habitable Worlds Observatory, the questions Webb has raised are just as exciting as the answers it’s giving us.” 

    Star Formation Flex

    The progression from a large molecular cloud to massive stars entails multiple steps, some of which are still not well understood by astronomers. Located approximately 4,000 light-years away in the constellation Scorpius, the Cat’s Paw Nebula offers scientists the opportunity to study the turbulent cloud-to-star process in great detail. Webb’s observation of the nebula in near-infrared light builds upon previous studies by NASA’s Hubble and retired Spitzer Space Telescope in visible- and infrared-light, respectively.

    With its sharp resolution, Webb shows never-before-seen structural details and features: Massive young stars are carving away at nearby gas and dust, while their bright starlight is producing a bright nebulous glow represented in blue. It’s a temporary scene where the disruptive young stars, with their relatively short lives and luminosity, have a brief but important role in the region’s larger story. As a consequence of these massive stars’ lively behavior, the local star formation process will eventually come to a stop.

    Opera House’s Intricate Structure

    Start with the toe bean at top center, which is nicknamed the “Opera House” for its circular, tiered-like structure. The primary drivers for the area’s cloudy blue glow are most likely toward its bottom: either the light from the bright yellowish stars or from a nearby source still hidden behind the dense, dark brown dust. 

    Just below the orange-brown tiers of dust is a bright yellow star with diffraction spikes. While this massive star has carved away at its immediate surroundings, it has been unable to push the gas and dust away to greater distances, creating a compact shell of surrounding material.

    Look closely to notice small patches, like the tuning fork-shaped area to the Opera House’s immediate left, that contain fewer stars. These seemingly vacant zones indicate the presence of dense foreground filaments of dust that are home to still-forming stars and block the light of stars in the background.

    Spotlight on Stars

    Toward the image’s center are small, fiery red clumps scattered amongst the brown dust. These glowing red sources mark regions where massive star formation is underway, albeit in an obscured manner. 

    Some massive blue-white stars, like the one in the lower left toe bean, seem to be more sharply resolved than others. This is because any intervening material between the star and the telescope has been dissipated by stellar radiation.

    Near the bottom of that toe bean are small, dense filaments of dust. These tiny clumps of dust have managed to remain despite the intense radiation, suggesting that they are dense enough to form protostars. A small section of yellow at the right notes the location of a still-enshrouded massive star that has managed to shine through intervening material.

    Across this entire scene are many small yellow stars with diffraction spikes. Bright blue-white stars are in the foreground of this Webb image, but some may be a part of the more expansive Cat’s Paw Nebula area.

    One eye-catching aspect of this Webb image is the bright, red-orange oval at top right. Its low count of background stars implies it is a dense area just beginning its star-formation process. A couple of visible and still-veiled stars are scattered throughout this region, which are contributing to the illumination of the material in the middle. Some still-enveloped stars leave hints of their presence, like a bow shock at the bottom left, which indicates an energetic ejection of gas and dust from a bright source.

    Further explore this subset of toe beans by embarking on a narrated tour or getting closer to the image. We also invite you to reminisce about Webb’s three years of science observations.

    The James Webb Space Telescope is the world’s premier space science observatory. Webb is solving mysteries in our solar system, looking beyond to distant worlds around other stars, and probing the mysterious structures and origins of our universe and our place in it. Webb is an international program led by NASA with its partners, ESA (European Space Agency) and CSA (Canadian Space Agency).

    To learn more about Webb, visit:

    https://science.nasa.gov/webb

    Continue Reading

  • NASA’s Roman Space Telescope Team Installs Observatory’s Solar Panels

    NASA’s Roman Space Telescope Team Installs Observatory’s Solar Panels

    On June 14 and 16, technicians installed solar panels onto NASA’s Nancy Grace Roman Space Telescope, one of the final steps in assembling the observatory. Collectively called the Solar Array Sun Shield, these panels will power and shade the observatory, enabling all the mission’s observations and helping keep the instruments cool.

    “At this point, the observatory is about 90% complete,” said Jack Marshall, the Solar Array Sun Shield lead at NASA’s Goddard Space Flight Center in Greenbelt, Maryland. “We just need to join two large assemblies, and then we’ll run the whole Roman observatory through a series of tests. We’re currently on track for launch several months earlier than the promised date of no later than May 2027.” The team is working toward launch as early as fall 2026.

    The Solar Array Sun Shield is made up of six panels, each covered in solar cells. The two central panels will remain fixed to the outer barrel assembly (the observatory’s outer shell) while the other four will deploy once Roman is in space, swinging up to align with the center panels.

    The panels will spend the entirety of the mission facing the Sun to provide a steady supply of power to the observatory’s electronics. This orientation will also shade much of the observatory and help keep the instruments cool, which is critical for an infrared observatory. Since infrared light is detectable as heat, excess warmth from the spacecraft’s own components would saturate the detectors and effectively blind the telescope.

    “Now that the panels have been installed, the outer portion of the Roman observatory is complete,” said Goddard’s Aaron Vigil, a mechanical engineer working on the array. Next, technicians will test deploy the solar panels and the observatory’s “visor” (the deployable aperture cover). The team is also testing the core portion of the observatory, assessing the electronics and conducting a thermal vacuum test to ensure the system operates as planned in the harsh space environment.

    This will keep the project on track to connect Roman’s inner and outer segments in November, resulting in a whole observatory by the end of the year that can then undergo pre-launch tests.

    To virtually tour an interactive version of the telescope, visit: https://roman.gsfc.nasa.gov/interactive/

    Download high-resolution video and images from NASA’s Scientific Visualization Studio

    The Nancy Grace Roman Space Telescope is managed at NASA’s Goddard Space Flight Center in Greenbelt, Maryland, with participation by NASA’s Jet Propulsion Laboratory in Southern California; Caltech/IPAC in Pasadena, California; the Space Telescope Science Institute in Baltimore; and a science team comprising scientists from various research institutions. The primary industrial partners are BAE Systems Inc. in Boulder, Colorado; L3Harris Technologies in Rochester, New York; and Teledyne Scientific & Imaging in Thousand Oaks, California.

    By Ashley Balzer
    NASA’s Goddard Space Flight Center, Greenbelt, Md.

    Continue Reading

  • Radar sees strange “plasma bubbles” over the pyramids of Egypt

    Radar sees strange “plasma bubbles” over the pyramids of Egypt

    A remote radar station on China’s Hainan Island has spotted an ionospheric disturbance hovering above the Pyramids of Giza, nearly 5,000 miles to the west.

    The sighting shows how far equatorial plasma bubble tracking has come, and it hints at new ways to protect the satellites and signals that knit the modern world together.

    Plasma bubbles and Chinese radar


    Lead author Lianhuan Hu of the Institute of Geology and Geophysics at the Chinese Academy of Sciences, heads the team that built the Low Latitude Long Range Ionospheric Radar, or LARID. 

    The phased‑array system designed by the researchers according to the study, fires high‑frequency pulses that bounce off the ionosphere, letting scientists map pockets of rarefied plasma far beyond the local horizon.

    During a geomagnetic storm in November of 2024, LARID recorded a bubble over Egypt while its antennas faced west, confirming a maximum detection range of about 5,965 miles.

    That span is more than three times the reach reported when the radar began test operations in early 2024, a gain achieved through software tweaks and better ionospheric modeling.

    Why plasma bubbles matter

    A plasma bubble is a cavern of depleted electrons that rises after sunset along Earth’s magnetic field lines, sometimes stretching hundreds of miles in diameter.

    Inside its rippling walls, radio scintillation disrupts GPS navigation, satellite TV, stock‑market time stamps, and even airline routes.

    “The walls of these equatorial plasma bubbles are where the communication and navigation signals are corrupted,” noted a NASA factsheet for the CINDI satellite mission.

    Because the bubbles flare up unpredictably, forecasters need real-time views that cover vast tropical oceans where ground sensors are scarce.

    How the radar reaches so far

    LARID transmits at 20 MHz, a sweet spot where the ionosphere refracts the beam back toward Earth instead of letting it escape to space.

    Each bounce, called a “hop,” extends the footprint; after one‑and‑a‑half hops, echoes can return from Africa or the central Pacific.

    For comparison, the high‑latitude SuperDARN radars, workhorses of auroral science, cover about 2,240 miles apiece, with a 2,237‑mile slant‑range limit.

    Hu’s radar system has 40 antennas, aimed both east and west, that can quickly shift their direction to scan a wide area of the sky in under a minute.

    LARID radar echoes

    The radar doesn’t observe plasma bubbles directly. Instead, it detects irregular echoes created by ionospheric scintillation, where signals scatter off unstable blobs of plasma at the edges of a bubble.

    To isolate these echoes from clutter or reflections off terrain, researchers look at Doppler shifts, signal width, and signal-to-noise ratios.

    The field-of-view of LARID during the extremely long-range experiment for EPB observation. The thick red and blue lines show the beams of LARID east and west radars, respectively. The green circles and black dots represent the locations of ionosondes and GNSS receivers used for validating the LARID observations, respectively. The black thick and dotted lines represent the dip equator and dip latitude of ±20°N, respectively. Credit: CAS
    The field-of-view of LARID during the extremely long-range experiment for EPB observation. The thick red and blue lines show the beams of LARID east and west radars, respectively. The green circles and black dots represent the locations of ionosondes and GNSS receivers used for validating the LARID observations, respectively. The black thick and dotted lines represent the dip equator and dip latitude of ±20°N, respectively. Click image to enlarge. Credit: CAS

    Fast‑moving echoes with broad spectral width and strong return strength signal active ionospheric disturbances.

    Plasma bubbles and space weather

    The Egyptian bubble appeared soon after the interplanetary magnetic field flipped southward, sparking a Kp 7 geomagnetic storm.

    That flip boosted eastward electric fields at dusk, lofting the equatorial F‑layer and priming conditions for the Rayleigh-Taylor instability that seeds bubbles.

    Ground GPS receivers in Africa registered sharp jumps in total electron content rate, an independent confirmation that the patch over Giza was real, not a radar artifact.

    In the same storm, LARID saw bubbles over the Pacific at sunset and again near Southeast Asia just before dawn, proving that one instrument can chase the nightly “space weather” tide across twelve time zones.

    Toward a global watch

    “The results provide meaningful insight for building a low latitude over‑the‑horizon radar network in future,” Hu and colleagues wrote, arguing that three or four such stations could survey the whole equatorial belt in real time.

    Placing sister arrays in Brazil, Indonesia, and West Africa would close today’s oceanic gaps and let operators reroute critical links before outages strike.

    Beyond civilian uses, militaries eye the data to shield over‑the‑horizon radars, HF communications, and encrypted satellite relays from sudden fades.

    Agencies that manage GNSS augmentation systems could feed bubble alerts into integrity monitors, trimming false alarms and keeping precision farming tractors or aircraft autoland systems online.

    What comes next

    Hu’s group is already experimenting with multi‑frequency sweeps that pinpoint bubble altitude, a metric vital for assimilating observations into physics‑based forecast models.

    They are also sharing echo maps with the international SuperDARN community to cross‑check mid‑latitude disturbances that spill out of the tropics.

    If funding aligns, a portable mini‑LARID may debut on Reunion Island in the Indian Ocean, extending coverage into a longitude sector notorious for sat‑nav dropouts during solar maximum.

    A successful trial there would cement the case for the global quartet and help stitch ionospheric weather into mainstream meteorology.

    The study is published in Geophysical Research Letters.

    —–

    Like what you read? Subscribe to our newsletter for engaging articles, exclusive content, and the latest updates. 

    Check us out on EarthSnap, a free app brought to you by Eric Ralls and Earth.com.

    —–


    Continue Reading

  • M-Matisse mission set to analyse Martian space weather

    M-Matisse mission set to analyse Martian space weather

    The M-Matisse mission marks a groundbreaking step in space exploration, as it is the first dedicated to studying Martian space weather and assessing the planet’s potential to support human life.

    Dr Beatriz Sanchez-Cano of the University of Leicester is leading the operation to revolutionise our knowledge of Mars’ climate, alongside Principal Investigators for the Mars Ensemble of Particle Instruments (M-EPI) and the Science Data Centre for mission coordination, planning, and science exploitation.

    The project is expected to receive approval from the European Space Agency (ESA) within the next year and will enable essential scientific research on the dynamics of the Martian System, aiding studies into the potential hazards astronauts may face on future journeys to the Red Planet.

    What is M-Matisse?

    Currently in Phase A study, the M-Matisse (Mars Magnetosphere ATmosphere Ionosphere and Space-weather SciencE) mission is one of ESA’s three candidates for its next ‘medium’ mission. Previous flying medium-class missions include Solar Orbiter and Euclid.

    The mission sets out to use two identical spacecraft with focused and high-technological payloads that have the ability to observe the space weather of Mars through observational perspective, using in-situ measurements and radio cross-talks to combine findings.

    A model of the M-MATISSE spacecraft.Credit: Dr Beatriz Sánchez-Cano/European Space Agency

    These robot orbiters have been named after French Artist Henry Matisse, an influential figure in the early 20th century due to his works in expressive colour and the Fauvist style, as well as his daughter Marguerite.

    Each capsule will work in separate areas; one will be confined to the plasma system and the other to the unexplored region of Mars’ far tail.

    Surveying space weather

    The mission will unravel Martian space weather through analysis of the different layers surrounding the planet; the magnetic-field region known as the Magnetosphere, the ionosphere (layer of the atmosphere that is ionised by solar wind) and the thermosphere (the thickest layer in the atmosphere) will be orbited predominantly, as well as investigating the lower atmosphere and the radiation build-up around Mars.

    By analysing the Martian system dynamics, researchers will also gain insight into the processes of energy dissipation through solar wind and how space activity affects surface reactions, which will ultimately lead to precise space weather forecasting and improved safety measures for upcoming projects.

    Sánchez-Cano is optimistic regarding the mission’s success as it “will provide the first global characterisation of the dynamics of the Martian system at all altitudes.”

    Towards lift-off

    The successful mission is set to be chosen by ESA by mid-2026. If approved, M-Matisse will launch a new era of Martian exploration – one where robotic missions not only gather data but also shape the safety and feasibility of future human expeditions.

    By offering a detailed picture of how solar activity interacts with the Martian environment, the mission will provide critical insights into the planet’s capacity to host life and the challenges astronauts may face.

    As space agencies across the world look beyond Earth orbit, understanding the space weather around Mars is no longer a theoretical exercise – it’s a vital necessity.

    With M-Matisse, Europe positions itself at the forefront of this frontier, leveraging cutting-edge instrumentation and international collaboration to decode one of the most complex systems in our solar system.

    Whether it’s protecting future astronauts from radiation or determining how Mars has evolved over billions of years, M-Matisse’s findings could shape the next chapter of human spaceflight.

    Continue Reading

  • Why scientists are so excited about the newfound interstellar comet 3I/ATLAS (op-ed)

    Why scientists are so excited about the newfound interstellar comet 3I/ATLAS (op-ed)

    Aster G. Taylor is a Ph.D. candidate in Astronomy and Astrophysics at the University of Michigan, Ann Arbor and a 2023 Fannie and John Hertz Foundation Fellow.

    Darryl Z. Seligman is a National Science Foundation Astronomy and Astrophysics Postdoctoral Fellow/Assistant Professor of Physics and Astronomy at Michigan State University.

    Continue Reading

  • Ancient proteins could transform palaeontology

    Ancient proteins could transform palaeontology

    ANCIENT PROTEINS nestled in fossils contain troves of information about long-dead creatures. However, like all ancient molecules, proteins degrade. Until recently the oldest proteins recovered for reliable, in-depth analysis were around 4m years old. But two separate studies published in Nature on July 9th, one by researchers at Harvard University and the Smithsonian Institute and another led by researchers at the University of Copenhagen, have recovered ancient proteins, some of which could be up to 29m years old. The discoveries should help palaeontologists investigate the behaviour, diet and evolution of animals long thought too old to be studied with molecular tools.

    Continue Reading

  • Mapping Mud Volcanoes in Shallow Seas

    Mapping Mud Volcanoes in Shallow Seas

    Mud volcanoes may be less imposing and less familiar than their distant cousins, lava volcanoes, but they come with hazards of their own, and their presence can signal hidden geologic processes shaping a landscape.

    A team of geologists has now made a global map of submarine mud volcanoes, which they hope will help further the understanding of these little-known landforms. The study, published earlier this year in Scientific Data, mapped more than a thousand mud volcanoes in shallow seas. A million more may sit undiscovered deep in the world’s oceans.

    No one had put all the mapped mud volcanoes in a single dataset until now, said study author Daniele Spatola, a marine geologist at Sapienza Università di Roma. Patterns that Spatola and his colleagues spotted in the dataset were published in another study appearing in the Journal of Marine Science and Engineering.

    Hazards and Emissions

    Mud volcanoes erupt when the pressure of gas trapped in rock becomes so strong that the rock is not able to hold it anymore, Spatola explained. Instead of lava, mud volcanoes spew a mix of gas, sediment, dissolved minerals, organic matter, water, and other fluids.

    Fields of mud volcanoes are found in different geologic settings around the world, including in oil and gas fields, above mantle hot spots, near active faults, and at the edge of tectonic plates. Their presence and activity can give scientists important clues about tectonic and volcanic activity, said Nils Asp, a marine geologist at the Universidade Federal do Pará in northern Brazil who was not involved in the research.

    “Mud volcanoes can be really dangerous.”

    The unstable ground mud volcanoes create can put oil rigs, telecom cables, and other subsurface infrastructure at risk. “Mud volcanoes can be really dangerous,” Spatola said, particularly those on land.

    They are also a not-insignificant source of methane and can also spew oxide-rich material and gases like carbon dioxide. “Carbon balances and climate models don’t take these emissions into account, and locally, they can be a problem in terms of increasing water acidity,” Asp said.

    Having a global inventory of what submarine mud volcanoes look like and where they occur could help scientists estimate how much methane is bubbling through these vents and reveal where hazards lie.

    Digging Through Records

    Spatola and his colleagues gathered data from earlier published studies for roughly 1,100 submarine mud volcanoes—the majority in water no deeper than about 200 meters (650 feet). For 700 of them, the researchers either had full size, shape, and location information or had location information and were able to estimate geometry.

    From these data, Spatola’s team created a freely available and downloadable database.

    Most of the mud volcanoes in the database (65%) are located in the Mediterranean Sea. This distribution may reflect sampling bias, according to the authors. Areas in the eastern Mediterranean are often prospected for oil and gas, for example, and had more data available for the researchers to mine.

    Other regions are less well mapped. “Probably, the number of mud volcanoes in the Atlantic is higher than what [appears in] the database, for example,” Spatola said.

    Roughly 60% of mud volcanoes in the database are medium sized, with an area of 0.5–9 square kilometers. Small (<0.5 square kilometer) and large (>9 square kilometers) volcanoes together make up less than a third of the mapped volcanoes.

    Giant mud volcanoes (defined as those covering an area larger than 20 square kilometers) are the rarest features in the database, making up about 4.5% of the mapped and classified total. Most of the very large or giant mud volcanoes are found in an area southeast of Japan where the Pacific and Philippine tectonic plates meet.

    An initial analysis of the database showed that the more small-sized volcanoes a region has, the fewer large or giant volcanoes there are. This kind of pattern, known as a power law, is recognizable in many geologic processes, including earthquake distribution. The researchers also found that the size of a mud volcano is not necessarily related to how deep it sits below the sea surface.

    The database could help inform regional health and safety measures, the study suggests, as the morphology of a mud volcano influences its geohazard potential. Tall and narrow volcanoes, for instance, are the most hazardous because they are more prone to instability.

    Deep Challenges

    Asp said that the database is “a solid starting point to be extended upon in further studies.”

    Researchers don’t know how many submarine mud volcanoes there are because only a small portion of the ocean floor has been mapped.

    “We need the help of the scientific community to improve this dataset. The more information we put into it, the better it will be.”

    “In many areas, there might be a dozen kilometers of distance between one mapped stretch and another,” Asp said. “So we have no information of what is in that [unmapped] part of the seafloor.”

    Some satellite imagery can penetrate a few dozen meters below the surface but not the deep ocean floor. To look that deep, marine researchers need ships capable of bathymetric mapping, but such instrumentation, including sonar and lidar equipment, is often prohibitively expensive.

    The new study is a first attempt to create a database of submarine mud volcanoes, one that can be refined as more data are contributed. “We need the help of the scientific community to improve this dataset,” said Spatola. “The more information we put into it, the better it will be.”

    —Meghie Rodrigues (@meghier.bsky.social), Science Writer

    Citation: Rodrigues, M. (2025), Mapping mud volcanoes in shallow seas, Eos, 106, https://doi.org/10.1029/2025EO250245. Published on 10 July 2025.
    Text © 2025. The authors. CC BY-NC-ND 3.0
    Except where otherwise noted, images are subject to copyright. Any reuse without express permission from the copyright owner is prohibited.

    Continue Reading

  • Forget 3D printing—DNA and water now build tiny machines that assemble themselves

    Forget 3D printing—DNA and water now build tiny machines that assemble themselves

    When the Empire State Building was constructed, its 102 stories rose above midtown one piece at a time, with each individual element combining to become, for 40 years, the world’s tallest building. Uptown at Columbia, Oleg Gang and his chemical engineering lab aren’t building Art Deco architecture; their landmarks are incredibly small devices built from nanoscopic building blocks that arrange themselves.

    “We can build now the complexly prescribed 3D organizations from self-assembled nanocomponents, a kind of nanoscale version of the Empire State Building,” said Gang, professor of chemical engineering and of applied physics and materials science at Columbia Engineering and leader of the Center for Functional Nanomaterials’ Soft and Bio Nanomaterials Group at Brookhaven National Laboratory.

    “The capabilities to manufacture 3D nanoscale materials by design are critical for many emerging applications, ranging from light manipulation to neuromorphic computing, and from catalytic materials to biomolecular scaffolds and reactors,” said Gang.

    In two papers, one released on July 9 in Nature Materials and a second on April 11 in ACS Nano, Gang and his colleagues describe a new methodology for fabricating targeted 3D nanoscale structures via self-assembly that can find use in a variety of applications, and they provide a design algorithm for others to follow suit.

    And it’s all based on the most basic biomolecular building blocks: DNA.

    One pot stop for new materials

    When it comes to small-scale fabrication of microelectronics, conventional approaches are based on top-down strategies. One common approach is photolithography, which uses powerful light and intricate stencils to etch circuits. But mainstream lithographic techniques struggle with complex, three-dimensional structures, while additive manufacturing, better known as 3D printing, cannot yet fabricate features at the nanoscale. In terms of workflow, both methods fabricate each feature one by one, in serial. This is an intrinsically slow process for building 3D objects.

    Taking his cues from bio-systems, Gang builds 3D materials and devices from the bottom up via self-assembly processes that are directed by DNA. He has been refining his method through collaborations with other scientists to build, for example, extremely small electronics that they need for their work.

    Two months ago, he and his former student, Aaron Michelson, now a staff scientist at Brookhaven National Laboratory’s Center for Functional Nanomaterials,delivered a prototype for collaborators at the University of Minnesota interested in creating 3D light sensors integrated onto microchips. They built the sensors by growing DNA scaffolds on a chip and then coating them with light-sensitive material.

    That device was just the first of many. In their latest paper in Nature Materials, Gang and his team establish an inverse design strategy for creating the desired 3D structures from a set of nanoscale DNA components and nanoparticles. The study presents four additional applications of their “DNA origami” approach to material design: a crystal-like structure comprised of one-dimensional strings and two-dimensional layers; a mimic of the materials found commonly in solar panels; another crystal that spins in a helical swirl; and, for collaborator Nanfang Yu, professor of applied physics at Columbia Engineering, a structure that will reflect light in particular ways for his goal of one day creating an optical computer.

    Using advanced characterization techniques, such as synchrotron-based x-ray scattering and electron microscopy methods, at Columbia and Brookhaven National Laboratories, the team confirmed that the resulting structures matched their designs and revealed the designed considerations for improving structure fidelity. Each of these unique structures assembled itself in water wells in Gang’s lab. This type of material formation is parallel in its nature since the components come together during the assembly process, meaning significant time- and cost-savings for 3D fabrication compared with traditional methods. The fabrication process is also environmentally friendly as the assembly occurs in water.

    “This is a platform that is applicable to many materials with many different properties: biological, optical, electrical, magnetic,” said Gang. The end result simply depends on the design.

    DNA design, made easy

    DNA folds predictably, as the four nucleic acids that make it up can only pair in particular combinations. But when the desired structure contains millions, if not billions of pieces, how do you come up with the correct starting sequence?

    Gang and his colleagues solve this challenge with an inverse structural design approach. “If we know the big structure with the function that we want to create, we can dissect that into smaller components to create our building blocks with structural, binding, and functional attributes required to form the desired structure,” said Gang.

    The building blocks are strands of DNA that fold into a mechanically robust eight-sided octahedral shape, which Gang refers to as a voxel, with connectors at each corner that link each voxel together. Many voxels can be designed to link up into a particular repetitive 3D motif using DNA encoding, similar to how jigsaw puzzle pieces form a complex picture. The repetitive motifs, in turn, are also assembled in parallel to create the targeted hierarchically organized structure. Collaborator Sanat Kumar, the Michael Bykhovsky and Charo Gonzalez-Bykhovsky Professor of Chemical Engineering at Columbia, provided a computational verification of Gang’s inverse design approach.

    To enable the inverse design strategy, the researchers must figure out how to design these DNA-based nanoscale “jigsaw puzzle pieces” with the minimal number needed to form the desired structure. “You can think of it like compressing a file. We want to minimize the amount of information for the DNA self-assembly to be most efficient,” said first author Jason Kahn, a staff scientist at BNL and previously a postdoc at Gang’s group. Dubbed Mapping Of Structurally Encoded aSsembly, or MOSES, this algorithm is like nano-scale CAD software, Gang adds. “It will tell you what DNA voxel to use to make a particular, arbitrarily defined 3D hierarchically ordered lattice.”

    From there, you can add diverse types of nano-“cargo” inside the DNA voxels that will imbue the final structure with particular properties. For example, gold nanoparticles were embedded to give unique optical properties, as demonstrated in Yu’s experiments. But, as shown previously, both inorganic and bio-derived nanocomponents can be integrated into these DNA scaffolds. Once the device was assembled, the team also “mineralized” it. They coated scaffolds with silica and then exposed them to heat to decompose the DNA, effectively converting the original organic scaffolding into a highly robust inorganic form.

    Gang continues to collaborate with Kumar and Yu to uncover design principles that will allow for the engineering and assembly of complex structures, hoping to realize even more complicated designs, including a 3D circuit intended to mimic the complex connectivity of the human brain.

    “We are well on our way to establishing a bottom-up 3D nanomanufacturing platform. We see this as a ‘”next-generation 3D printing’” at the nanoscale, but now the power of DNA-based self-assembly allows us to establish massively parallel fabrication,” said Gang.

    Continue Reading