SpaceX launched two more sets of Starlink satellites on back-to-back, coast-to-coast flights on Friday and Saturday.
First up, a Falcon 9 rocket launched from Space Launch Complex 4 East at Vandenberg Space Force Base in California on March 13….

SpaceX launched two more sets of Starlink satellites on back-to-back, coast-to-coast flights on Friday and Saturday.
First up, a Falcon 9 rocket launched from Space Launch Complex 4 East at Vandenberg Space Force Base in California on March 13….

Researchers have found that electrons in graphene can break a long-standing rule of metal physics, separating heat flow from electrical flow by more than 200 times at low temperatures.
The discovery shows that electrons in this atom-thin carbon…

Nearly a mile beneath the ocean’s surface, the seafloor looks very different from the bright coral reefs most people know.
No sunlight reaches this depth. The water is cold and dark. Yet coral reefs still grow there, slowly forming large…
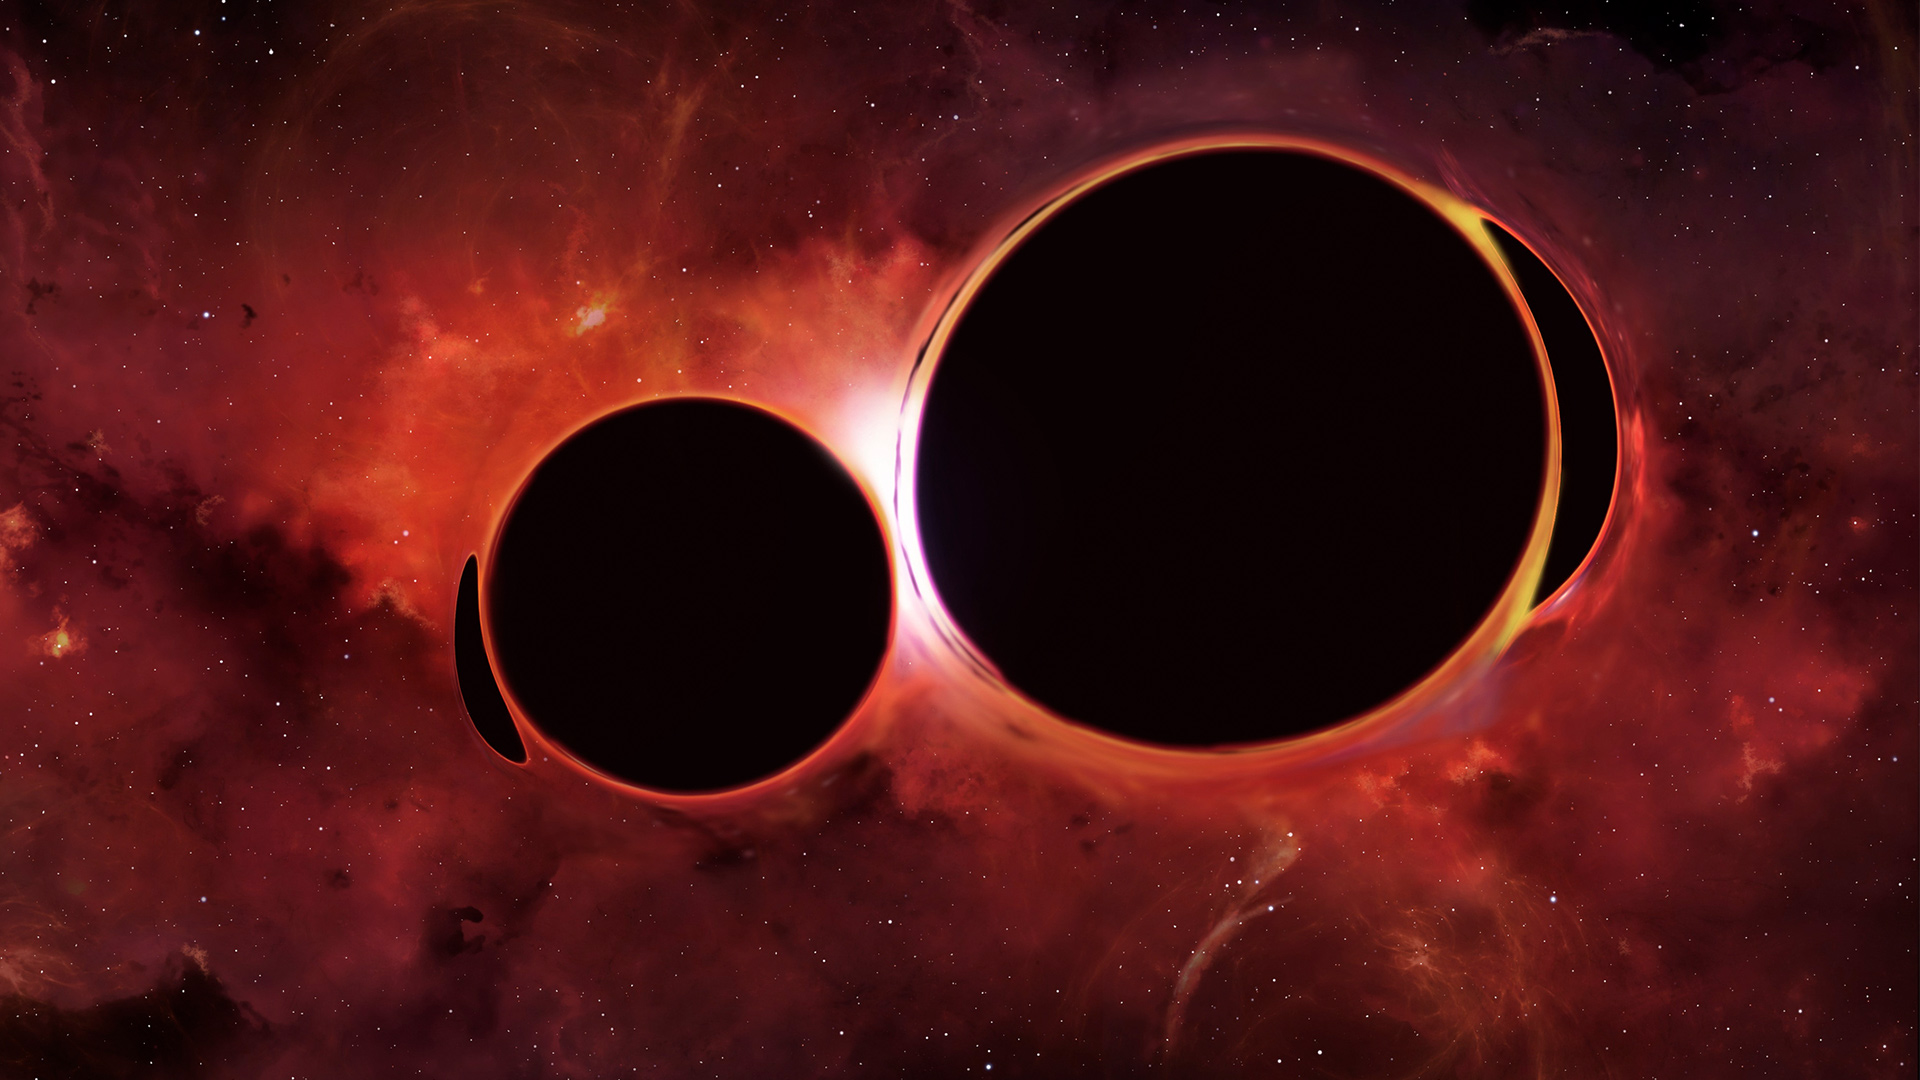
In November 2024, gravitational-wave detectors recorded the violent merger of two black holes billions of light-years away. Normally, such events are invisible to telescopes, producing only faint ripples in spacetime. However, this time…
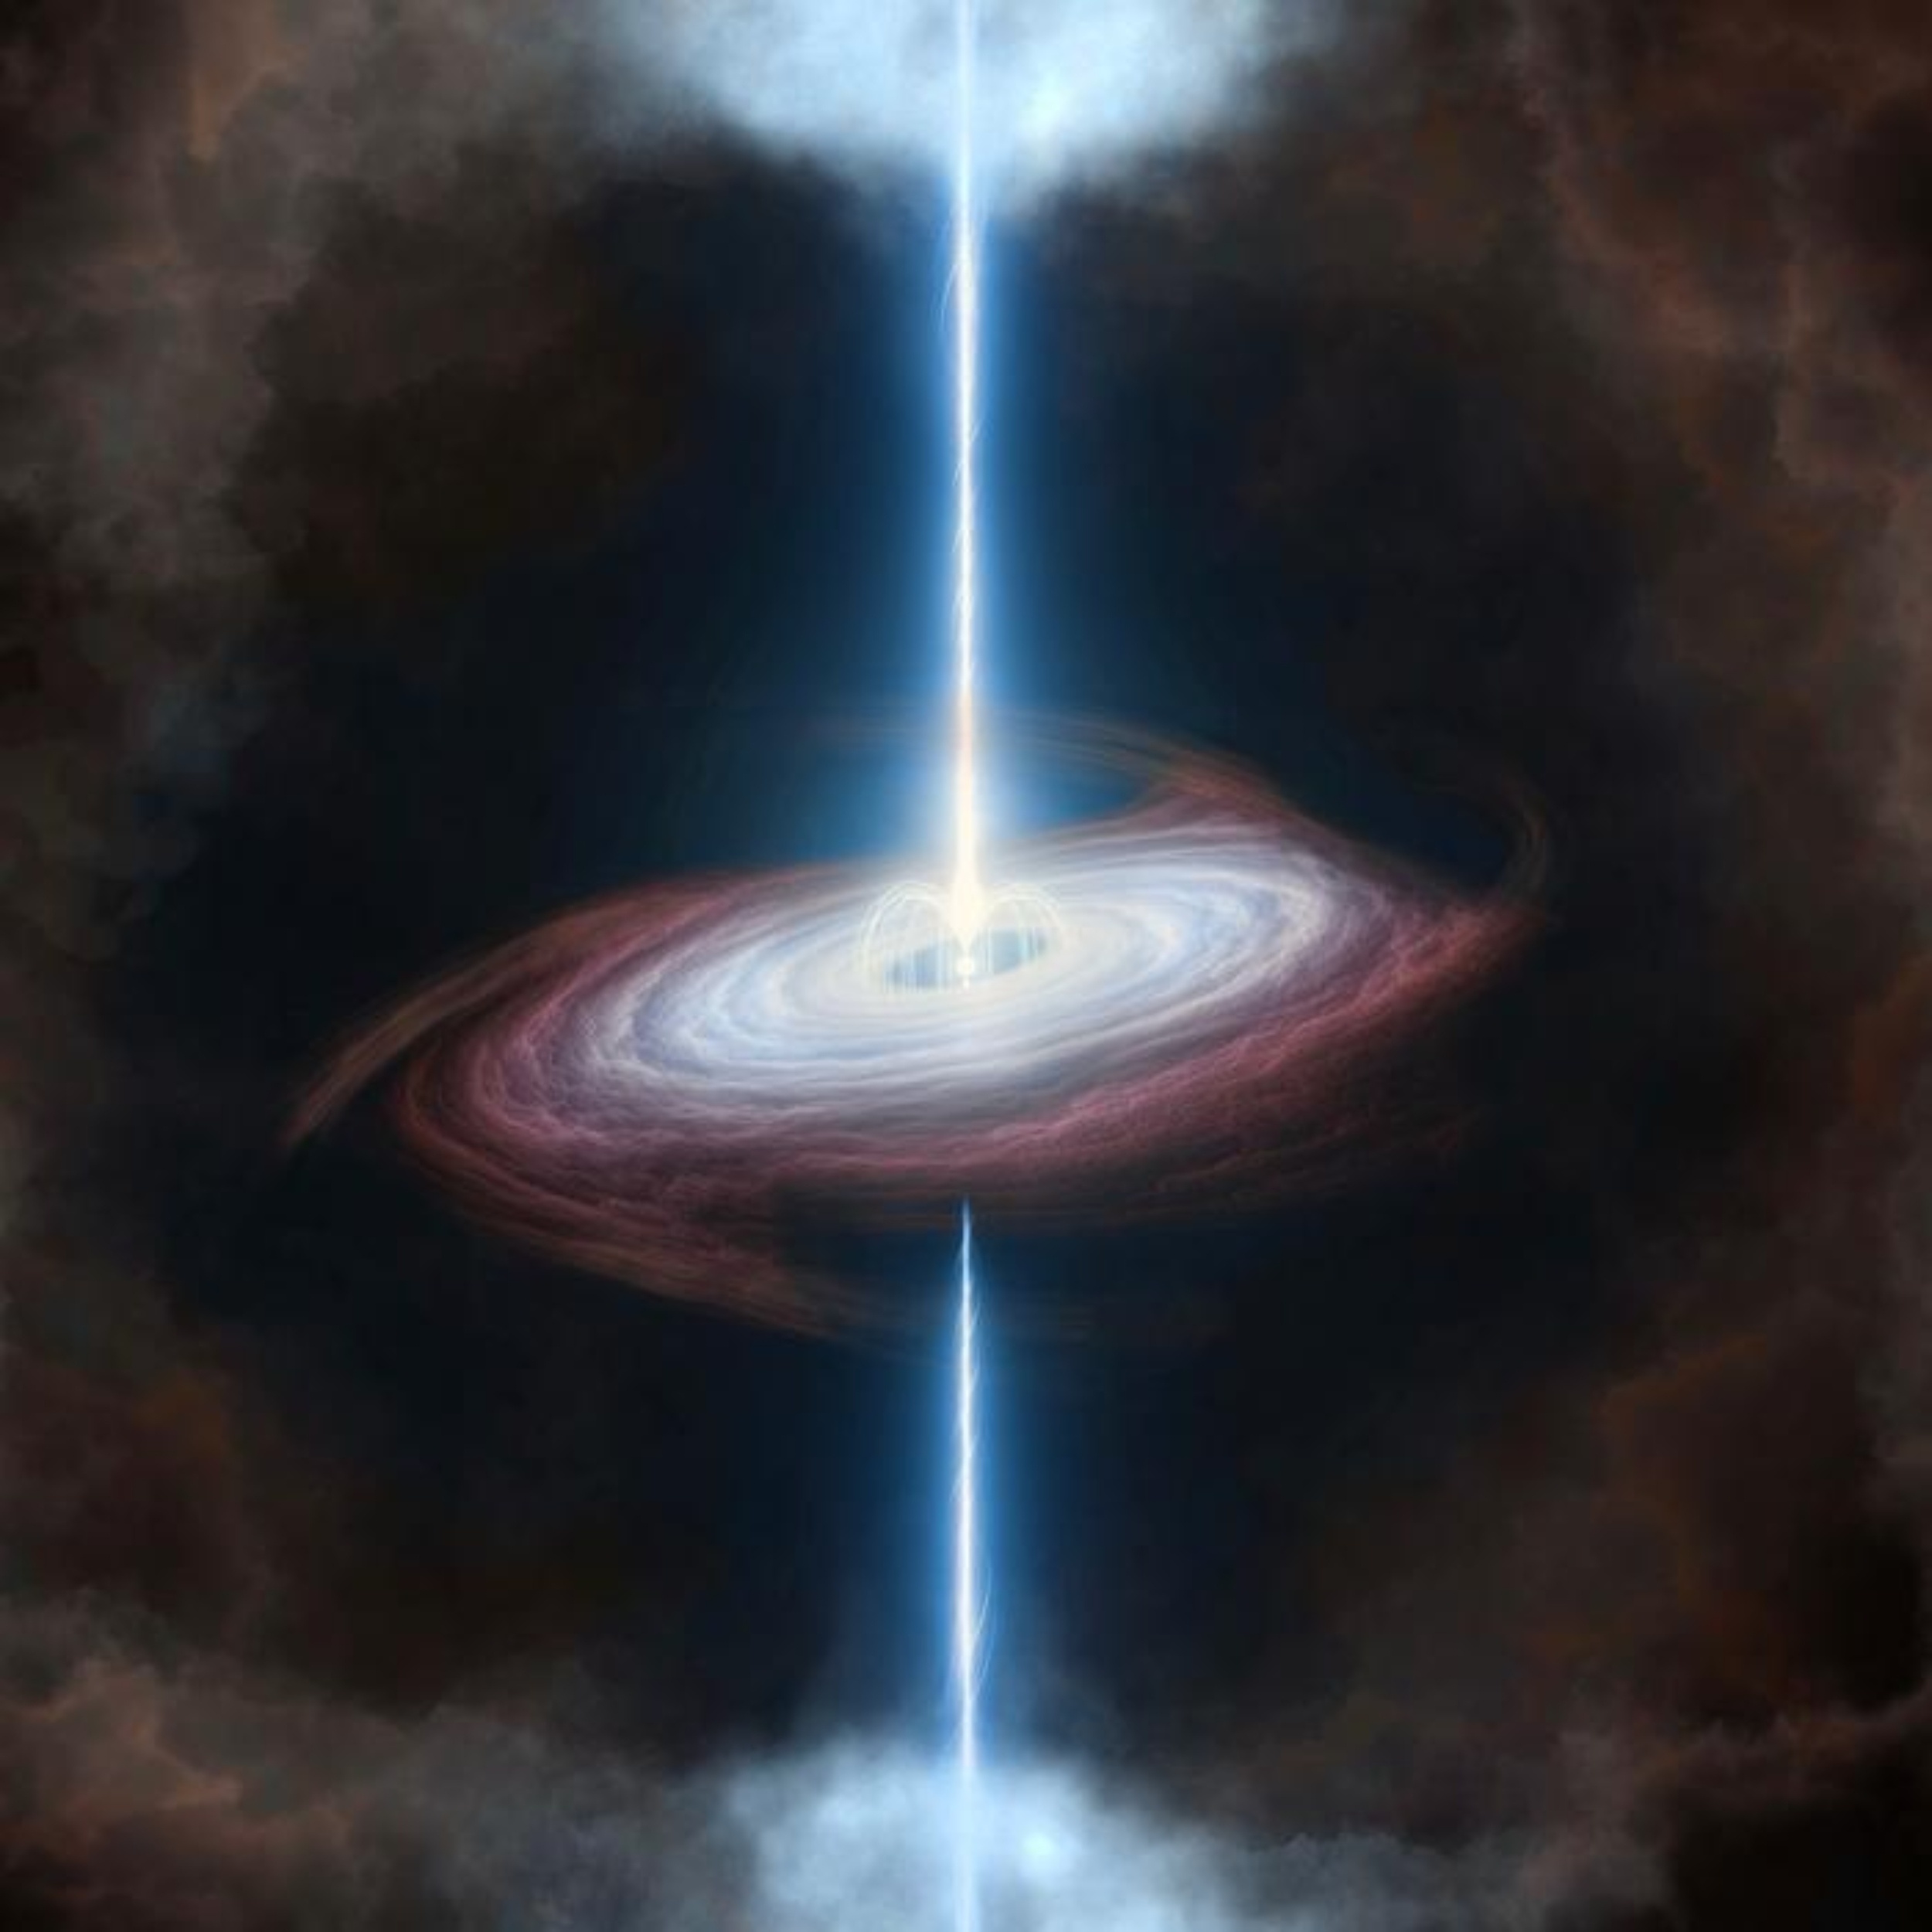
Magnetars are among the most powerful objects in the universe, but astronomers rarely get the chance to see one being born.
When massive stars die, they usually follow a familiar script. The star runs out of fuel, its core collapses, and the…

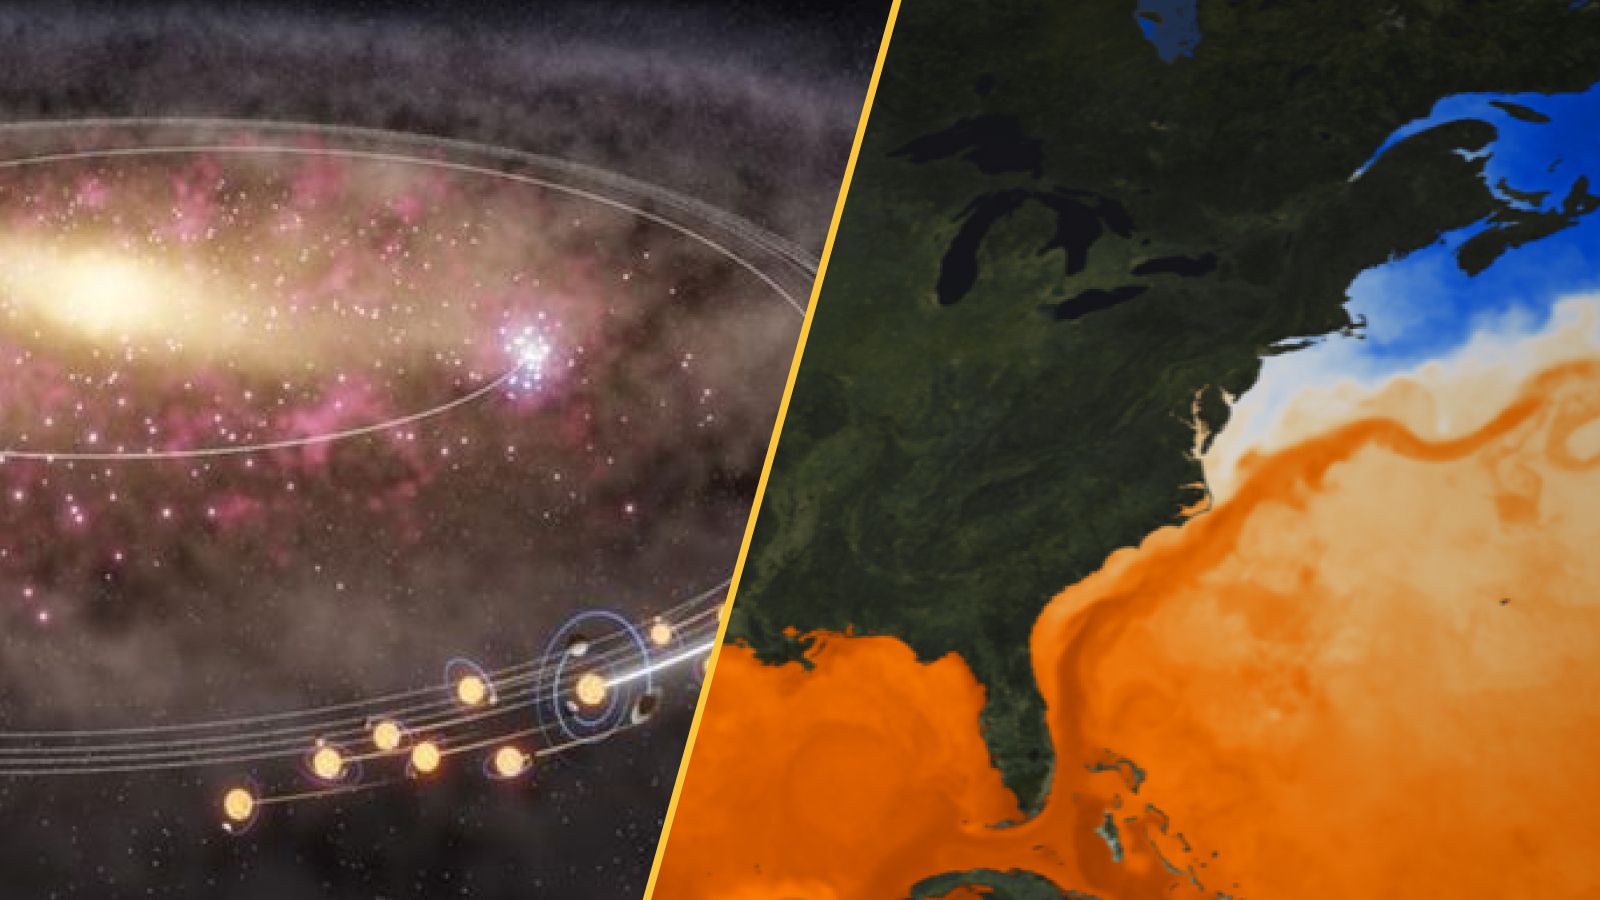
Heavy elements such as gold and platinum are born in some of the Universe’s most violent events. These heavy elements form when stars collapse or when neutron stars collide, triggering a rapid chain of nuclear reactions known as the r-process….
This week’s science news was bursting with discoveries of archaeological treasures, starting with the revelation that a foundation stone for a Czech garden barn was actually a Bronze Age spearhead mold.
The mold, carved into ancient volcanic…
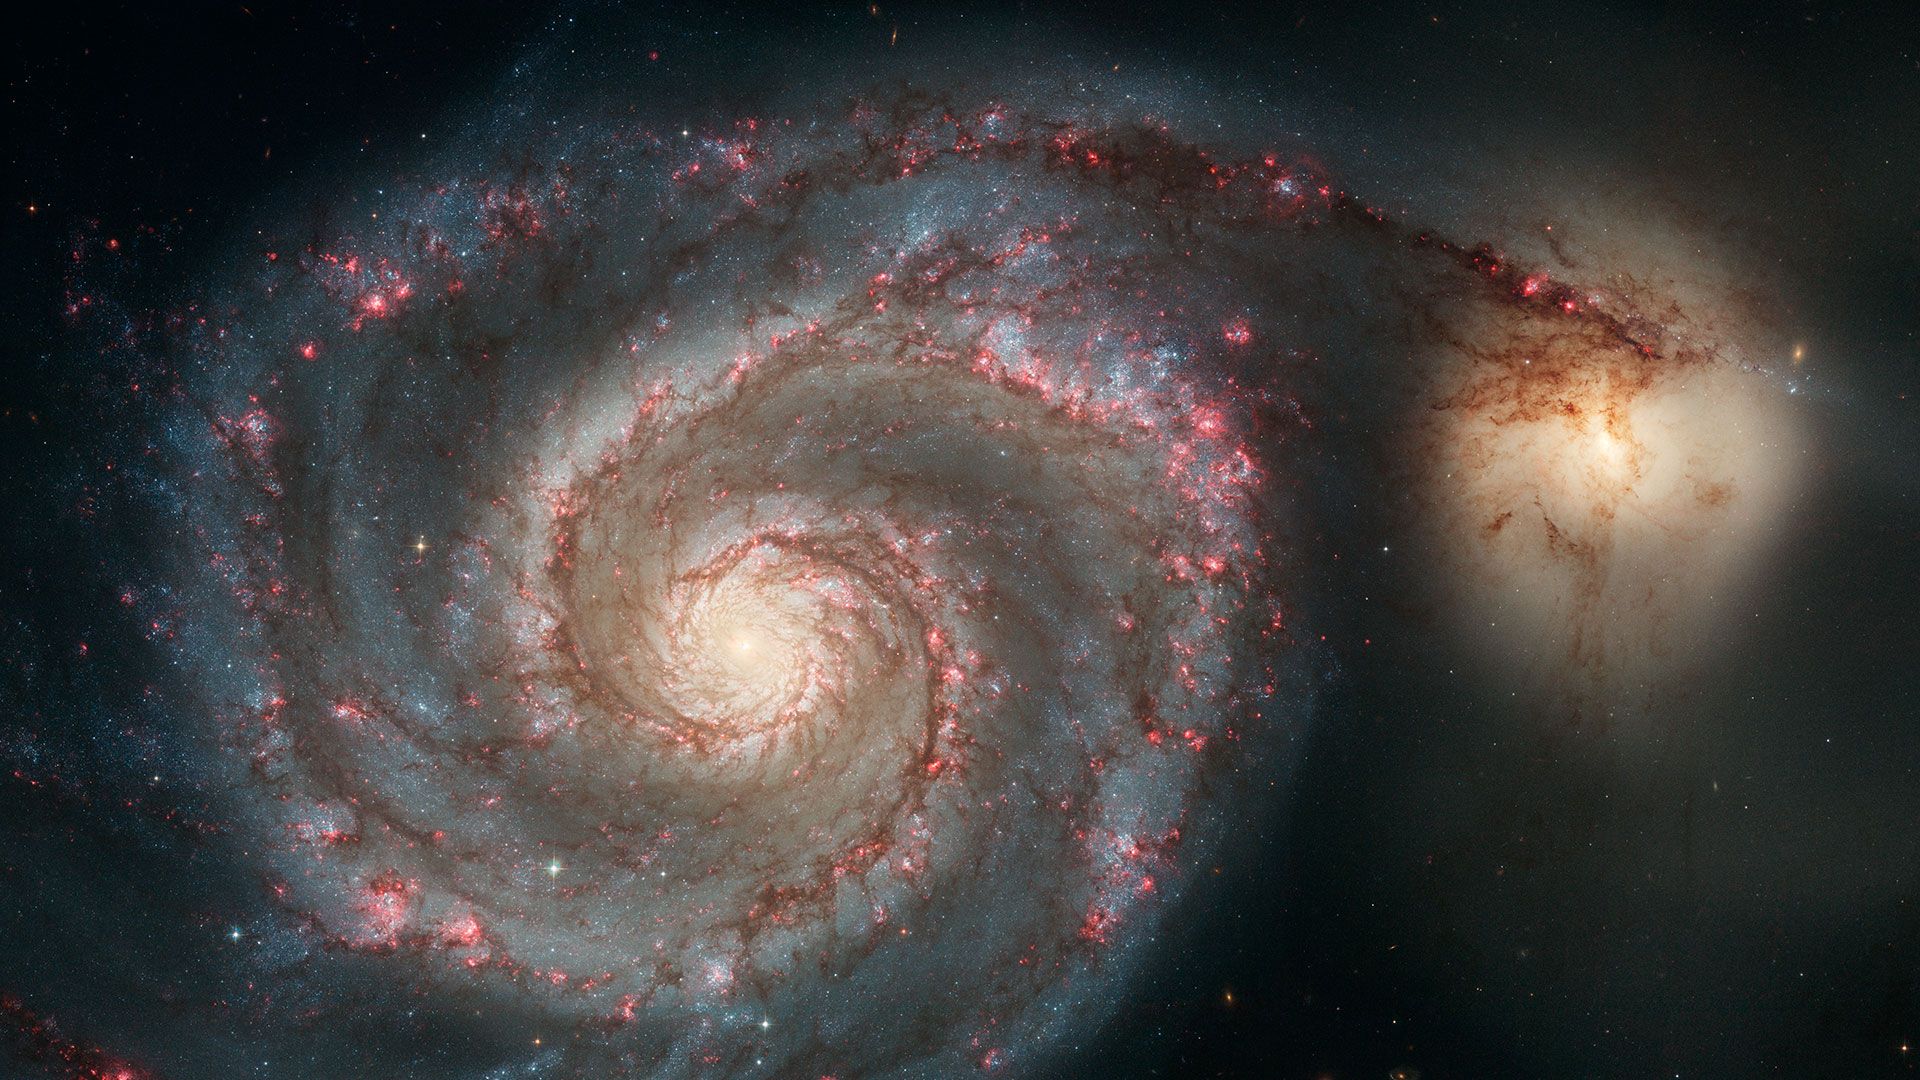
Spring is almost here, which means it’s galaxy season for amateur astronomers! Grab your telescope and join us as we highlight some of the most beautiful galactic targets visible in the spring night sky over the coming months.
Van de Peer, Y., Mizrachi, E. & Marchal, K. The evolutionary significance of polyploidy. Nat. Rev. Genet. 18, 411–424. https://doi.org/10.1038/nrg.2017.26 (2017).
Gillard, G. B. et al….

You might not be aware of this, but the Earth actually casts a huge shadow into space, and…