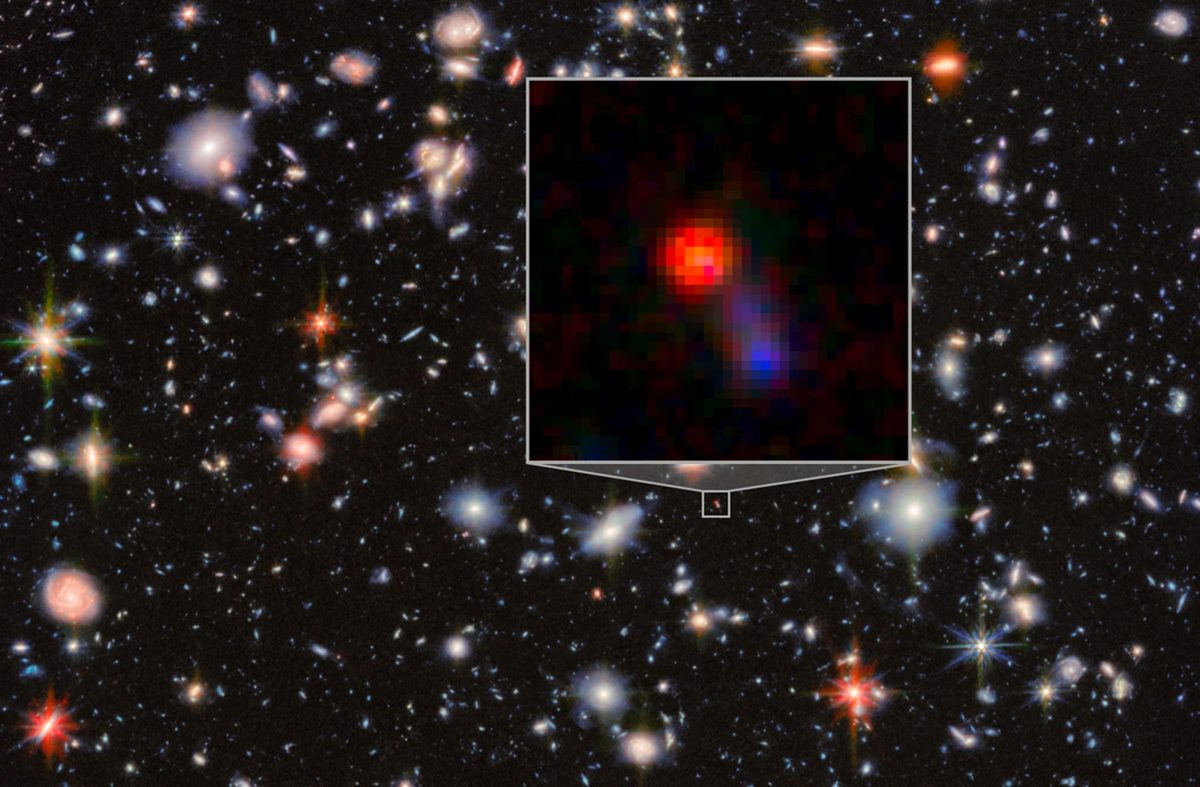
There’s something strange going on in the early Universe.
The James Webb Space Telescope has peered so deep into the cosmos, it’s effectively been able to look back in time to show what the Universe was like just after the Big Bang.
It’s found…
There’s something strange going on in the early Universe.
The James Webb Space Telescope has peered so deep into the cosmos, it’s effectively been able to look back in time to show what the Universe was like just after the Big Bang.
It’s found…

A new University of Utah-led study has discovered the mechanism behind a decades-old evolutionary mystery-how “selfish chromosomes” cheat the rules of genetic inheritance. The researchers found that rogue chromosomes hijack…
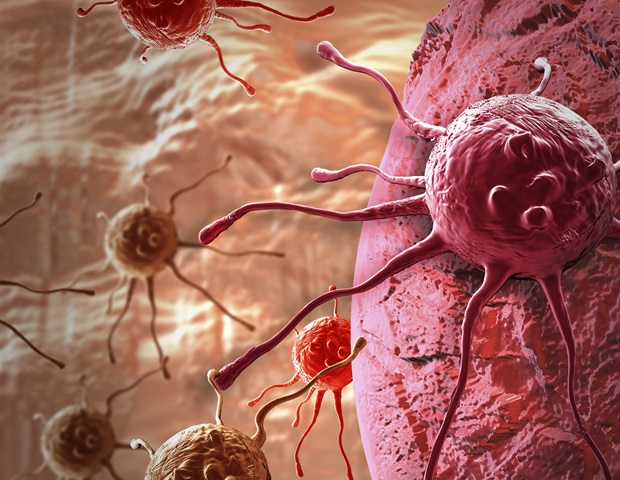
A lack of vitamin B2 makes tumor cells more susceptible to a unique form of cell death. This was discovered by researchers at the Rudolf Virchow Centre at the University of Würzburg.
The human body cannot produce vitamin B2 –…

Tungsten carbide-cobalt (WC-Co) is widely valued for its extreme hardness, but that same strength also makes it very difficult to shape and manufacture. Current production methods consume large amounts of costly material while delivering…
Tungsten carbide-cobalt (WC-Co) is widely valued for its extreme hardness, but that same strength also makes it very difficult to shape and manufacture. Current production methods consume large amounts of costly material while delivering…
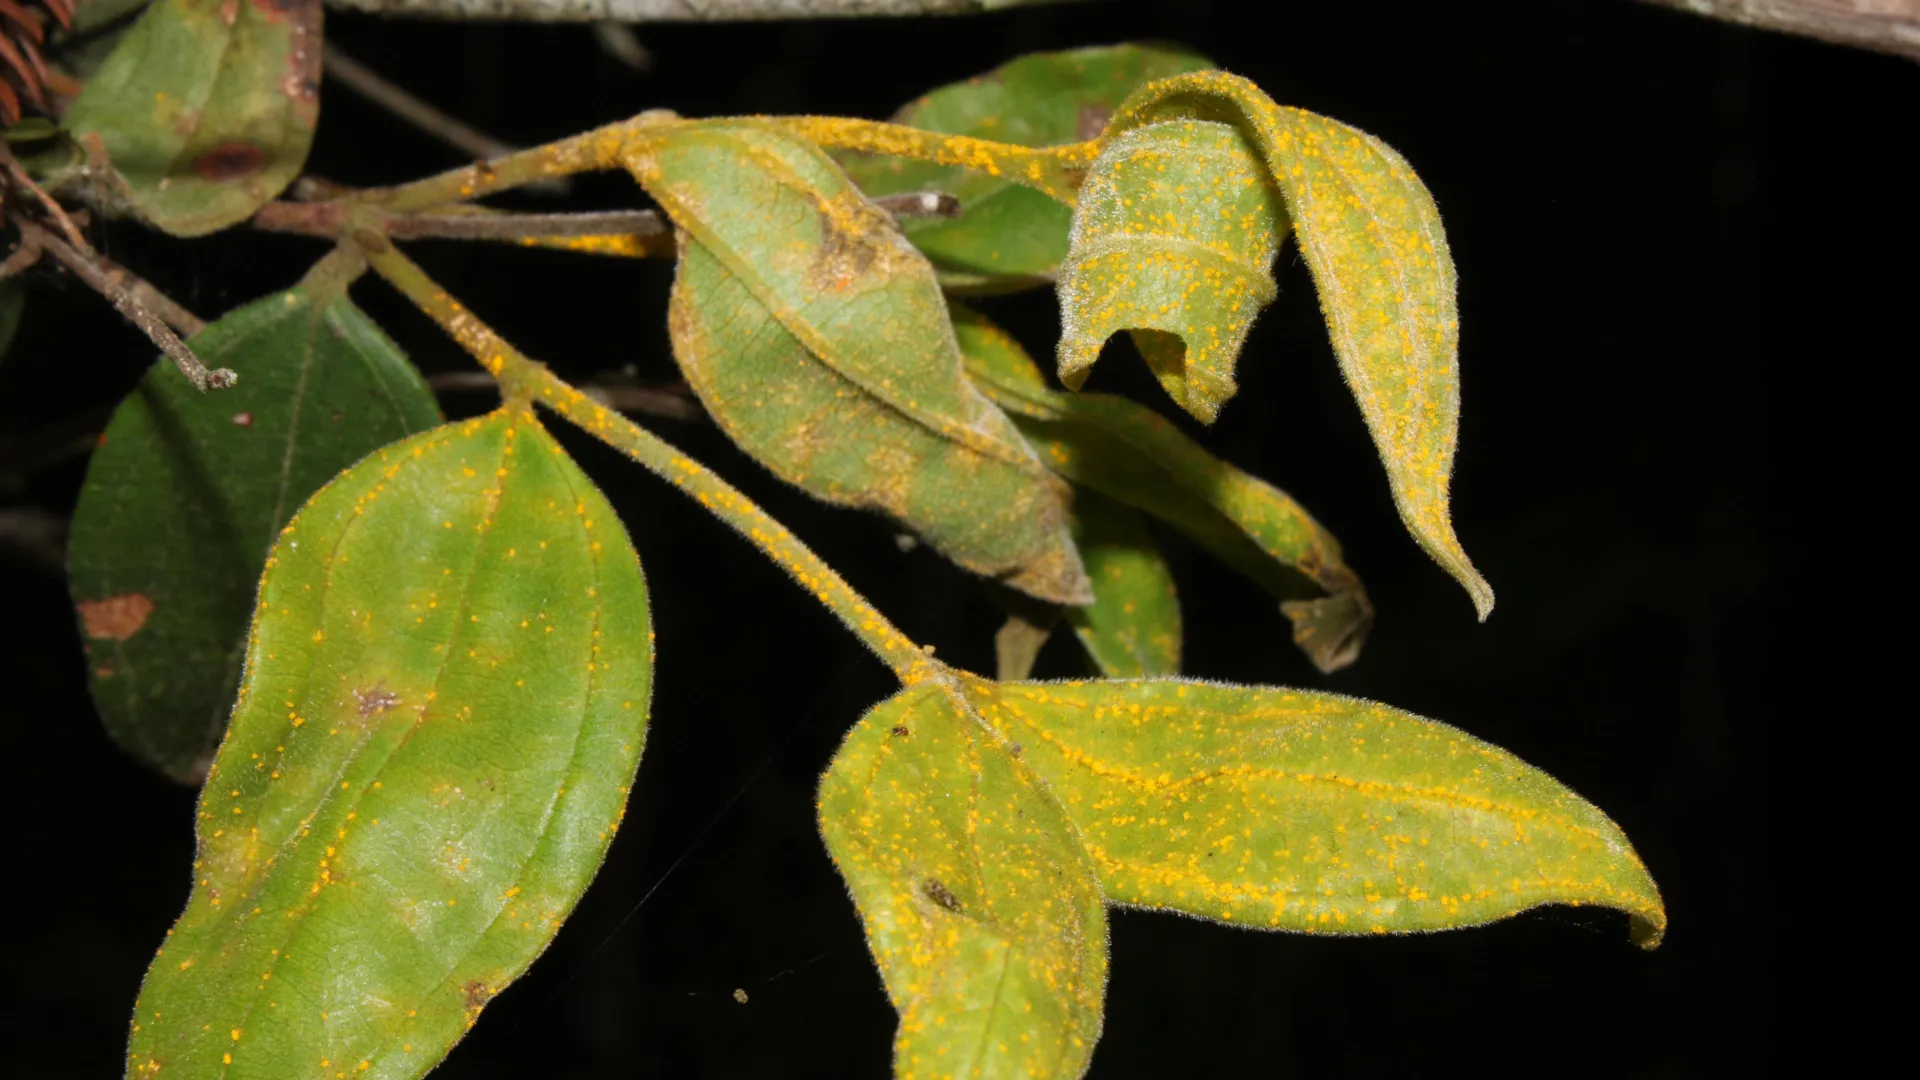
Researchers have given a newly identified Australian tree species an unusual nickname. Scientists call it the “zombie” tree because, although some individuals are still alive, the species is unable to grow and reproduce normally without major…
Researchers have given a newly identified Australian tree species an unusual nickname. Scientists call it the “zombie” tree because, although some individuals are still alive, the species is unable to grow and reproduce normally without major…
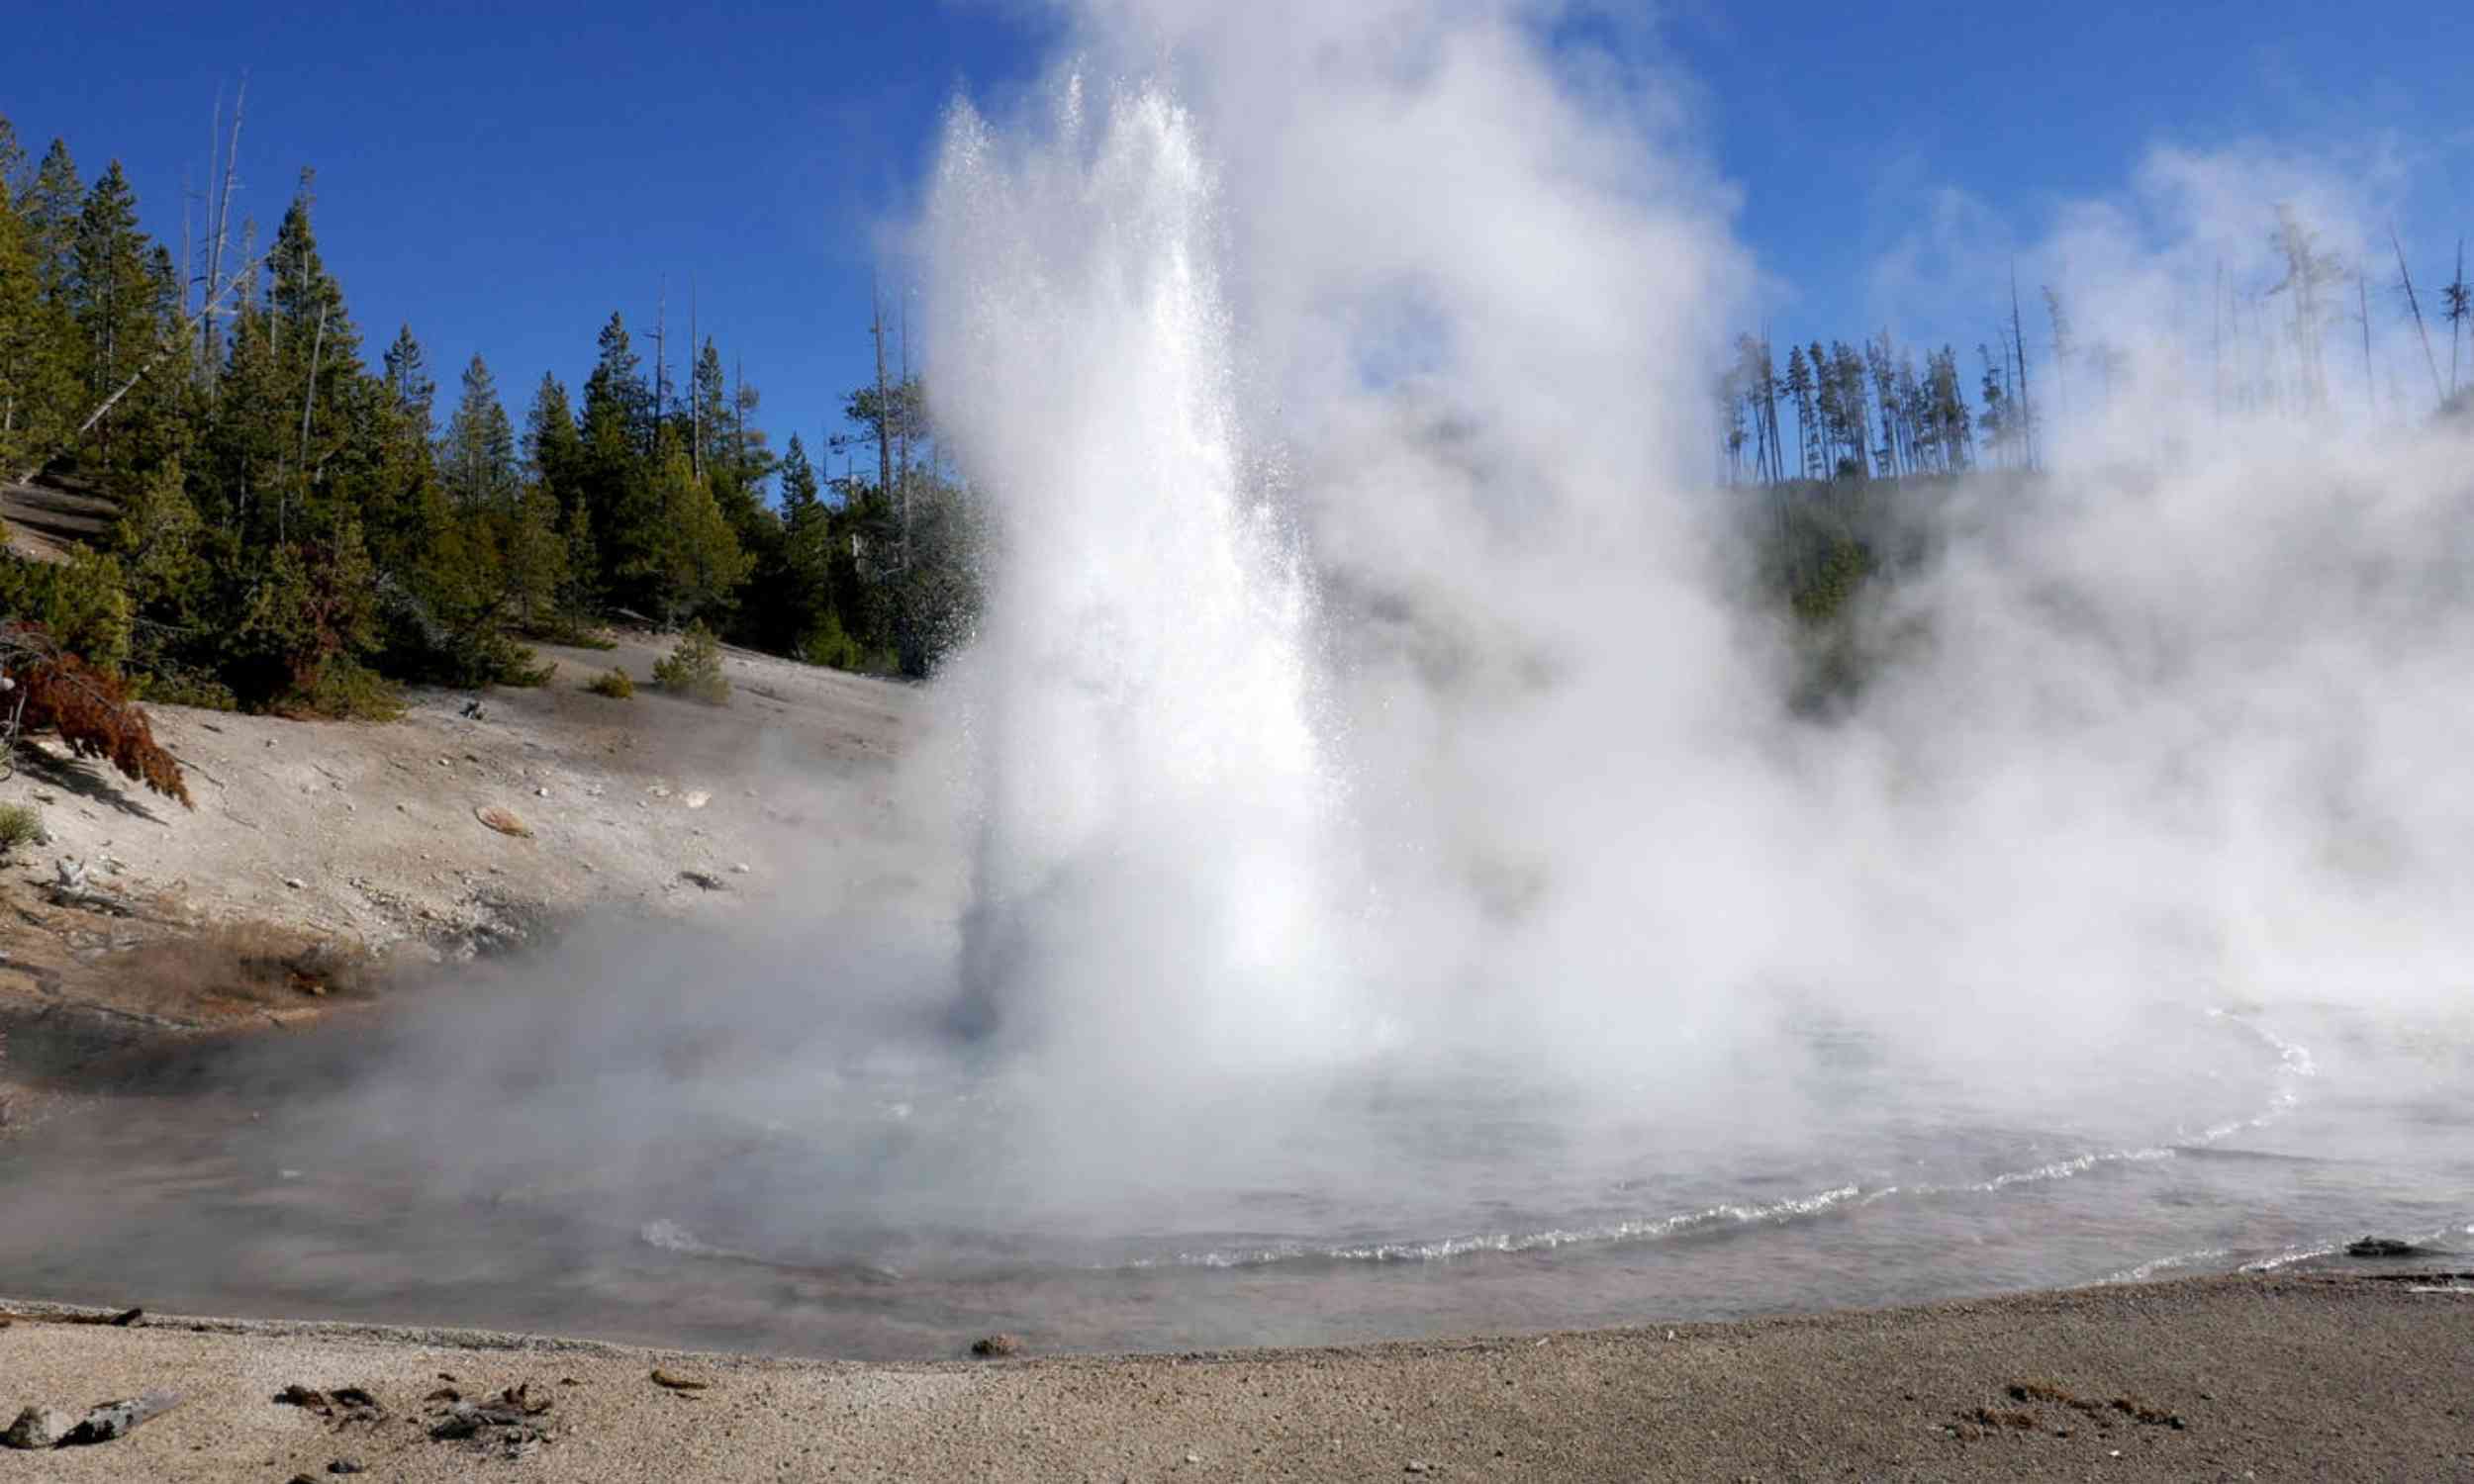
Scientists have documented that Yellowstone’s rare acidic Echinus geyser has resumed erupting after more than five years of inactivity.
The return of one of the park’s few acid-driven geysers highlights a fragile underground balance that…
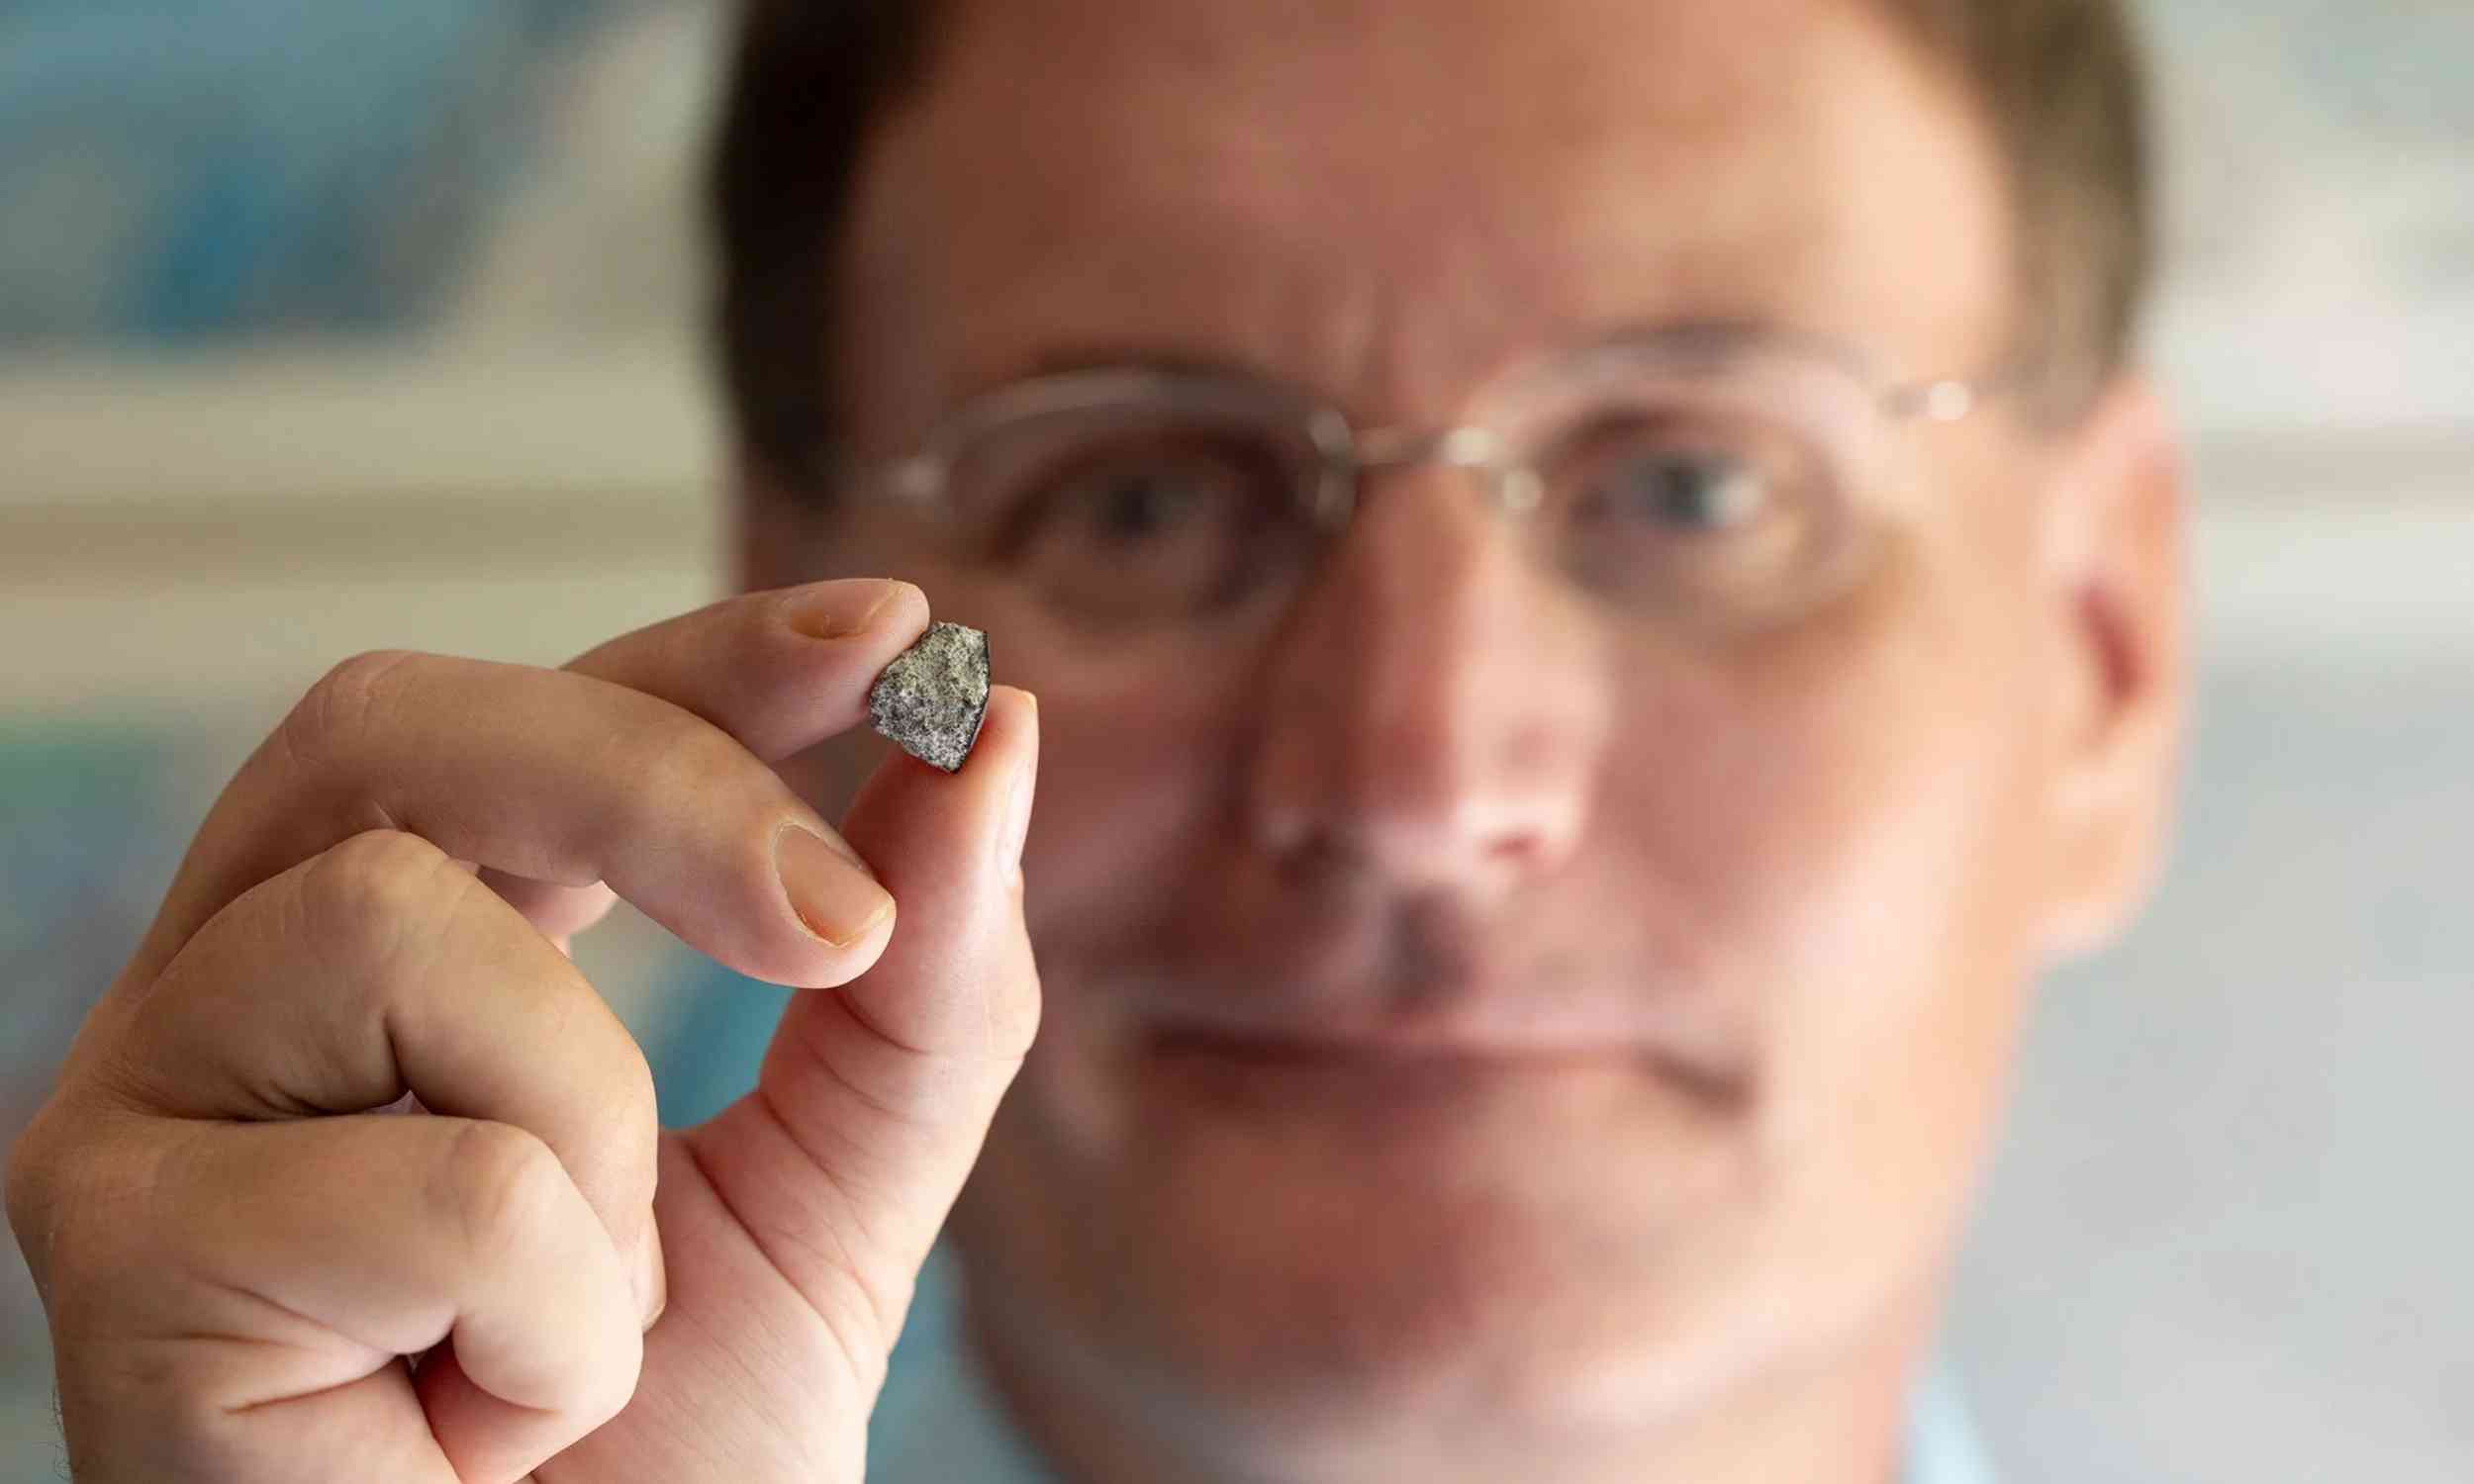
Scientists have identified a meteorite that smashed through a Georgia home as a fragment of an asteroid formed about 4.56 billion years ago, older than Earth itself.
That finding turns a brief, destructive fall into a rare physical sample from the…
Earth’s peak greenness has shifted decisively toward the northeast over the past four decades, establishing a measurable relocation of the planet’s living surface.
That steady drift redraws where seasonal plant growth concentrates, altering…