Category: 7. Science

  • Earth’s Seasons Are Out of Sync, Scientists Discover From Space : ScienceAlert

    Earth’s Seasons Are Out of Sync, Scientists Discover From Space : ScienceAlert

    The annual clock of the seasons – winter, spring, summer, autumn – is often taken as a given.

    But our new study in Nature, using a new approach for observing seasonal growth cycles from satellites, shows that this notion is far too simple.

    We present an unprecedented and intimate portrait of the seasonal cycles of Earth’s land-based ecosystems. This reveals “hotspots” of seasonal asynchrony around the world – regions where the timing of seasonal cycles can be out of sync between nearby locations.

    Related: Scientists Detected Signs of a Structure Hiding Inside Earth’s Core

    We then show these differences in timing can have surprising ecological, evolutionary, and even economic consequences.

    Watching the seasons from space

    The seasons set the rhythm of life. Living things, including humans, adjust the timing of their annual activities to exploit resources and conditions that fluctuate through the year.

    The study of this timing, known as “phenology”, is an age-old form of human observation of nature. But today, we can also watch phenology from space.

    The average seasonal growth cycles of Earth’s land-based ecosystems, estimated from 20 years of satellite imagery. (Terasaki Hart et al., Nature, 2025)

    With decades-long archives of satellite imagery, we can use computing to better understand seasonal cycles of plant growth. However, methods for doing this are often based on the assumption of simple seasonal cycles and distinct growing seasons.

    This works well in much of Europe, North America and other high-latitude places with strong winters. However, this method can struggle in the tropics and in arid regions. Here, satellite-based estimates of plant growth can vary subtly throughout the year, without clear-cut growing seasons.

    Surprising patterns

    By applying a new analysis to 20 years of satellite imagery, we made a better map of the timing of plant growth cycles around the globe. Alongside expected patterns, such as delayed spring at higher latitudes and altitudes, we saw more surprising ones too.

    YouTube Thumbnail allowfullscreen=”allowfullscreen” frameborder=”0″>
    Average seasonal cycles of plant growth around the world. Each pixel varies from its minimum (tan) to its maximum (dark green) throughout the year.

    One surprising pattern happens across Earth’s five Mediterranean climate regions, where winters are mild and wet and summers are hot and dry. These include California, Chile, South Africa, southern Australia, and the Mediterranean itself.

    These regions all share a “double peak” seasonal pattern, previously documented in California, because forest growth cycles tend to peak roughly two months later than other ecosystems. They also show stark differences in the timing of plant growth from their neighbouring drylands, where summer precipitation is more common.

    Spotting hotspots

    This complex mix of seasonal activity patterns explains one major finding of our work: the Mediterranean climates and their neighbouring drylands are hotspots of out-of-sync seasonal activity. In other words, they are regions where the seasonal cycles of nearby places can have dramatically different timing.

    Consider, for example, the marked difference between Phoenix, Arizona (which has similar amounts of winter and summer rainfall) and Tucson only 160 km away (where most rainfall comes from the summer monsoon).

    Map of the world showing patterns of light and dark
    Hotspots of seasonal asynchrony: brighter colours show regions where the timing of seasonal activity varies a lot over short distances. (Terasaki Hart et al., Nature, 2025)

    Other global hotspots occur mostly in tropical mountains. The intricate patterns of out-of-sync seasons we observe there may relate to the complex ways in which mountains can influence airflow, dictating local patterns of seasonal rainfall and cloud.

    These phenomena are still poorly understood, but may be fundamental to the distribution of species in these regions of exceptional biodiversity.

    Seasonality and biodiversity

    Identifying global regions where seasonal patterns are out of sync was the original motivation for our work. And our finding that they overlap with many of Earth’s biodiversity hotspots – places with large numbers of plant and animal species – may not be a coincidence.

    In these regions, because seasonal cycles of plant growth can be out of sync between nearby places, the seasonal availability of resources may be out of sync, too. This would affect the seasonal reproductive cycles of many species, and the ecological and evolutionary consequences could be profound.

    One such consequence is that populations with out-of-sync reproductive cycles would be less likely to interbreed. As a result, these populations would be expected to diverge genetically, and perhaps eventually even split into different species.

    If this happened to even a small percentage of species at any given time, then over the long haul these regions would produce large amounts of biodiversity.

    Back down to Earth

    We don’t yet know whether this has really been happening. But our work takes the first steps towards finding out.

    We show that, for a wide range of plant and animal species, our satellite-based map predicts stark on-ground differences in the timing of plant flowering and in genetic relatedness between nearby populations.

    Our map even predicts the complex geography of coffee harvests in Colombia. Here, coffee farms separated by a day’s drive over the mountains can have reproductive cycles as out of sync as if they were a hemisphere apart.

    Understanding seasonal patterns in space and time isn’t just important for evolutionary biology. It is also fundamental to understanding the ecology of animal movement, the consequences of climate change for species and ecosystems, and even the geography of agriculture and other forms of human activity.

    Want to know more? You can explore our results in more detail with this interactive online map, which we also include below.The Conversation

    Drew Terasaki Hart, Ecologist, CSIRO

    This article is republished from The Conversation under a Creative Commons license. Read the original article.

    Continue Reading

  • Don’t miss Venus line up with Jupiter and Mercury before sunrise on Sept. 1

    Don’t miss Venus line up with Jupiter and Mercury before sunrise on Sept. 1

    Jupiter, Venus and Mercury will appear together in the predawn sky on Sept. 1. (Image credit: Created by Anthony Wood in Canva.)

    Early risers are in for a spectacular show next week, when Jupiter, Venus and Mercury form a planetary lineup in the predawn sky on Sept. 1.

    Look above the eastern horizon in the hours preceding dawn on Sept. 1 to find Venus shining among the stars of the constellation Cancer, with Jupiter visible as a bright point of light roughly 20 degrees to the amber planet’s upper right. It’s useful to remember the width of your clenched fist held at arm’s length accounts for roughly 10 degrees of sky.

    Continue Reading

  • The Challenge of Measuring the Mass of 3I/ATLAS | by Avi Loeb | Aug, 2025

    The Challenge of Measuring the Mass of 3I/ATLAS | by Avi Loeb | Aug, 2025

    Press enter or click to view image in full size

    (Credit: Ciyavula)

    The biggest uncertainty about the interstellar object 3I/ATLAS involves the diameter of its solid-density nucleus. The flux detected by the SPHEREx space observatory at a wavelength of 1 micrometer from 3I/ATLAS on August 8–12, 2025 suggests a huge nucleus or alternatively an opaque dust cloud that scatters sunlight with a diameter of 46 kilometers (as reported here). The limited resolution of the Hubble Space Telescope image does not provide a robust constraint on the fraction of sunlight reflected by the nucleus relative to a surrounding dust cloud. The theoretical inference drawn from the data (accessible here) is highly model-dependent and does not resolve the existing uncertainty about the size of 3I/ATLAS.

    If the reflecting region has solid density, then its 46-kilometer diameter implies a nucleus mass of about 10^{20} grams, a million times bigger than the estimate for the previous interstellar comet 2I/Borisov.

    Since the nucleus mass scales as diameter cubed, measuring the mass of 3I/ATLAS would tightly constrain its size. What are the possible ways to measure the mass of this intriguing interstellar object?

    One way to gauge the nucleus mass is through the rocket equation. The force acting on the object equals the excess of its mass loss rate towards the Sun times the outflow speed relative to its surface. Dividing this non-gravitational force by the object’s non-gravitational acceleration gives its mass. In principle, all three parameters: the mass loss rate, the outflow velocity and the non-gravitational acceleration, can be measured. The mass loss rate of CO2 from 3I/ATLAS was inferred from the recent Webb telescope data to be 129 kilograms per second, and the outflow speed was estimated at 0.44 kilometers per second (both discussed here). The product of these measured quantities yields for a 46-kilometer solid a non-gravitational acceleration of order 6×10^{-11} centimeter per second squared (or equivalently 3×10^{-14} Earth-Sun separations (AU) per day squared). This level of acceleration is an order of magnitude below the lowest levels measured for solar system objects (reported here). Hence, the non-gravitational acceleration will be detectable if the mass loss rate increases as 3I/ATLAS approaches the Sun, or if the diameter of its nucleus is smaller. A sub-kilometer diameter is required to reconcile the discrepancy between a high mass for 3I/ATLAS and the reservoir of rocky material in interstellar space, as I noted in my first paper on 3I/ATLAS (accessible here). In that case, the reduced diameter would imply a nucleus mass below 10^{15} grams and a non-gravitational acceleration above 6×10^{-6} centimeters per second squared (or equivalently 3×10^{-9} AU per day squared), only 50 times smaller than the large value measured for 1I/`Oumuamua (as reported here).

    Since the mass loss rate scales with area and the non-gravitational acceleration scales inversely with volume, the rocket equation is a good approach for measuring the mass of small objects. In the opposite limit of large objects, gravity offers a better gauge.

    On October 3, 2025, 3I/ATLAS will pass within a distance of 29 million kilometers from Mars. As a result of its gravitational influence, it will give Mars a kick as if the two objects were fuzzy billiard balls. The magnitude of the velocity kick is given by the gravitational acceleration that its mass, M, exerts at the distance of closest approach to Mars, b, namely: (GM/b²) with G being Newton’s constant, times the period of time over which 3I/ATLAS acts strongly on Mars, (2b/v), given their relative velocity v. For M~10^{20} grams, b=29 million kilometers, and v~90 kilometers per second, one gets a velocity kick of ~3×10^{-7} centimeters per second. Unfortunately, this kick is unmeasurable given the uncertainties in the orbit of Mars or any other Solar system planet that 3I/ATLAS will interact with.

    Of course, the kick would have been larger if 3I/ATLAS were to maneuver and get closer to Mars. The so-called Minimum Orbit Intersection Distance (MOID) of 3I/ATLAS from Mars, namely the closest that 3I/ATLAS gets to the complete path of Mars around the Sun is remarkably short, just 0.018 AU or 2.7 million kilometers. This by itself constitutes another rare anomaly of 3I/ATLAS. If 3I/ATLAS is a technological mothership, this proximity makes it easy for it to release a mini-probe that would reach Mars easily with the appropriate ejection velocity. In addition, a small orbit correction by 3I/ATLAS could shrink this MOID of Mars to zero.

    But as Francis Bacon noted: “If the mountain won’t come to Muhammad, then Muhammad must go to the mountain.” NASA should use all the fuel available to bring the Juno spacecraft as close as possible to 3I/ATLAS when it passes within 34 million kilometers from Jupiter on March 16, 2026 as discussed in my paper with Adam Hibberd and Adam Crowl (accessible here). The gravitational deflection that might be introduced by 3I/ATLAS to the path of Juno can later be used for an exquisite mass measurement of 3I/ATLAS.

    In the coming months, we might have the privilege of measuring the mass of 3I/ATLAS by applying the rocket equation to its mass loss or measuring the gravitational kick it gives to various objects along its path.

    Following the advice of basketball coaches to their team players, we must keep our eyes on the ball and not on the audience. The nature of 3I/ATLAS will be decided by better data and not the number of likes or premature Nobel Prize promises on social media.

    ABOUT THE AUTHOR

    Press enter or click to view image in full size

    (Image Credit: Chris Michel, National Academy of Sciences, 2023)

    Avi Loeb is the head of the Galileo Project, founding director of Harvard University’s — Black Hole Initiative, director of the Institute for Theory and Computation at the Harvard-Smithsonian Center for Astrophysics, and the former chair of the astronomy department at Harvard University (2011–2020). He is a former member of the President’s Council of Advisors on Science and Technology and a former chair of the Board on Physics and Astronomy of the National Academies. He is the bestselling author of “Extraterrestrial: The First Sign of Intelligent Life Beyond Earth” and a co-author of the textbook “Life in the Cosmos”, both published in 2021. The paperback edition of his new book, titled “Interstellar”, was published in August 2024.

    Continue Reading

  • NASA wants to put a nuclear reactor on the moon by 2030 – choosing where is tricky

    NASA wants to put a nuclear reactor on the moon by 2030 – choosing where is tricky

    This article was originally published at The Conversation. The publication contributed the article to Space.com’s Expert Voices: Op-Ed & Insights.

    In a bold, strategic move for the U.S., acting NASA Administrator Sean Duffy announced plans on Aug. 5, 2025, to build a nuclear fission reactor for deployment on the lunar surface in 2030. Doing so would allow the United States to gain a foothold on the moon by the time China plans to land the first taikonaut, what China calls its astronauts, there by 2030.

    Continue Reading

  • Spiders Spotted Using Trapped Fireflies to Lure Prey

    Spiders Spotted Using Trapped Fireflies to Lure Prey

    A new study has documented something that appears to be intentional cruelty in spiders. Not only are they catching fireflies, they’re keeping them alive just long enough to turn them into bait.

    Researchers studying Psechrus clavis, a sheet web spider native to East Asia, noticed their webs often held live, glowing fireflies. The spiders didn’t eat them right away. They waited. Other insects, drawn to the light, were also trapped. Those insects were eaten immediately. The fireflies were left to glow until they weren’t helpful anymore.

    Published in the Journal of Animal Ecology, the study describes how the spiders’ hunting success increased dramatically when a firefly was left hanging in the web. “Our findings highlight a previously undocumented interaction where firefly signals, intended for sexual communication, are also beneficial to spiders,” said lead author I-Min Tso of Tunghai University in a statement.

    Spiders Spotted Trapping Fireflies in Their Webs for Bait

    To confirm the glow was doing the work, the researchers set up fake webs with LED lights that mimicked fireflies. Those webs attracted three times more prey than unlit controls. They even drew in ten times more fireflies than the unlit ones, which suggested the spiders weren’t just getting lucky.

    Most of the trapped fireflies were male, likely mistaking the steady glow for a female waiting nearby. But rather than attacking immediately, the spiders waited. They circled back to check on the still-living insects, only feeding once the glow had faded and the lure had done its job. Brutal.

    Tso and his team think the spiders may be responding to bioluminescent cues, using them to identify the fireflies and delay feeding. “Handling prey in different ways suggests that the spider can use some kind of cue to distinguish between the prey species,” he said.

    Predators like anglerfish evolved their own glow to lure food. These spiders don’t need to. They just let their prey do the work for them.

    There’s no delicate way to frame it. A glowing male, broadcasting his availability, gets trapped and left alive while moths and midges die instantly. Then more insects arrive.

    The spider remains still beneath the web while the firefly keeps glowing above it. The light does what it was meant to do, just not for the reason it was made.


    Continue Reading

  • SpaceX deploys 28 Starlink satellites into low Earth orbit after launch from Florida

    SpaceX deploys 28 Starlink satellites into low Earth orbit after launch from Florida

    “Deployment of 28 Starlink satellites confirmed.”

    With that statement, posted to social media, SpaceX wrapped another launch in support of its broadband internet satellite megaconstellation on Sunday (Aug. 31). The 28 Starlink satellites (Group 10-14) lifted off atop a Falcon 9 rocket from Space Launch Complex 40 at Cape Canaveral Space Force Station in Florida.

    The one-hour and five-minute mission to low Earth orbit began at 7:49 a.m. EDT (1149 GMT) on Sunday.

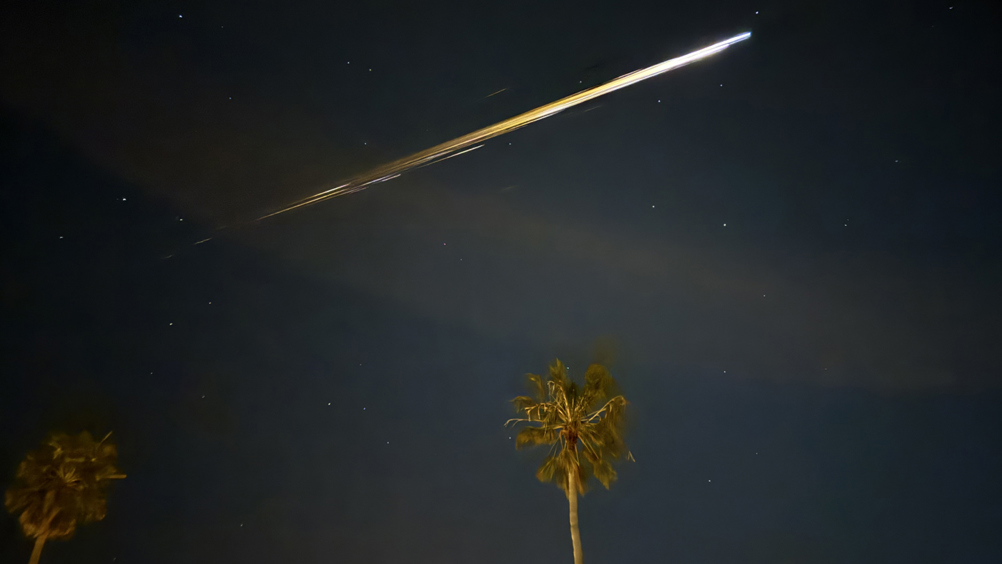
    A time lapse photo of a SpaceX Falcon 9 rocket shows the streak of its thrust as it launches from Cape Canaveral Space Force Station in Florida on Sunday, Aug. 31, 2025. (Image credit: SpaceX)

    Continue Reading

  • Try to spot a rare Aurigid meteor as the shower peaks overnight on Aug. 31

    Try to spot a rare Aurigid meteor as the shower peaks overnight on Aug. 31

    Why not try your luck in late August and try to spot a rare Aurigid shooting star as the shower comes to a peak later this weekend?

    The Aurigid meteor shower takes place each year as Earth travels through the tenuous debris trail shed by the long-period comet C/1911 N1 Kiess, which is thought to have last travelled through the inner solar system some 2,000 years ago.

    Continue Reading

  • 3I/ATLAS’s Coma Is Largely Carbon Dioxide

    3I/ATLAS’s Coma Is Largely Carbon Dioxide

    All (or at least most) astronomical eyes are on 3I/ATLAS, our most recent interstellar visitor that was discovered in early July. Given its relatively short observational window in our solar system, and especially its impending perihelion in October, a lot of observational power has been directed towards it. That includes the most powerful space telescope of them all – and a recent paper pre-printed on arXiv describes what the James Webb Space Telescope (JWST) discovered in the comet’s coma. It wasn’t like any other it had seen before.

    3I/ATLAS’s coma, which is the material surrounding its nucleus, is primarily made up of carbon dioxide (CO2), according to the paper first authored by Martin Cordiner of NASA’s Goddard Space Flight Center and the Catholic University of America. It also contains water, carbon monoxide and carbonyl sulfide, all of which are expected to be in a comet’s coma. But the ratio of carbon dioxide to water is 8 to 1, the highest ever seen in a comet, and six standard deviations above the typical value. Strangely, the carbon monoxide (CO) ratio with water is more in line with previous observations, at 1.4.

    To detect these chemicals, JWST used its NIRSpec infrared camera to observe 3I/ATLAS on August 6th, when it was 3.32 AU from the Sun. Other indications, which weren’t quite as surprising, include that the coma does have a bunch of water and dust scattered around it, as well as a higher dust concentration facing the Sun, which is typically for higher outgassing on the side the Sun heats.

    NASA Explains what we know about 3I/ATLAS so far.

    Another finding was that the ratio of two types of carbon isotopes, Carbon-12 and Carbon-13, was broadly similar to that found on Earth, suggesting the material was created in an environment with similar carbon species. However, there are a couple of features of 3I/ATLAS’s creation that could have caused the lopsided CO2/H2O ratio.

    One is extremely high levels of ultraviolet radiation in the host star system the object was created it. Another could be that is was created beyond the CO2 “ice line”, where carbon dioxide ice is relatively abundant compared to water. Other explanations have to do with how heat from the Sun is able to affect the nucleus – if it is harder to heat up, then CO2, which has a lower melting point than water, would be sublimated first, accounting for the lopsided ratio despite having plenty of water stored in the nucleus waiting to be released as it gets closer to the Sun.

    Either way, more observations are needed. This is only the third interstellar visitor we have confirmed, and the first (‘Oumuamua) wasn’t bright enough to capture its coma’s spectra, though even if it was it didn’t appear to have a coma anyway. That leaves the second interstellar visitor 2I/Borisov, as our only other point of comparison for the coma spectra of an interstellar comet. It actually had a higher carbon monoxide to water ratio, even as compared to 3I/ATLAS’s, so it seems of the two we have collected so far, each interstellar visitor’s coma hide new insights.

    Fraser discusses how 3I/ATLAS is actively releasing water.

    This undoubtedly won’t be the last paper examining 3I/ATLAS’s coma – it probably won’t even be the last one from JWST. We still have a few weeks of observational time before it passes too close to the Sun to be detectable, and then reaches its perihelion in early October, which it is still obscured from our view, though there is a chance some probes at Mars might be able to catch a glimpse of it during that time. When it finally becomes visible again in December, it will already be on its way out of our solar system, and likely would have shed most of the material it was going to. Sometimes astronomical events are fleetings, and astronomers have to try to capture them as they’re happening. At least with this one they’ll have a little bit of warning – we’ll see what they find as they continue to observe our newest interstellar visitor.

    Learn More:

    M. A. Cordiner et al – JWST detection of a carbon dioxide dominated gas coma surrounding interstellar object 3I/ATLAS

    UT – 3I/ATLAS Is Very Actively Releasing Water

    UT – Hubble Captures Stunning View of Third Interstellar Visitor

    UT – Gemini North Sees Brightening Interstellar Comet 3I/ATLAS in Detail

    Continue Reading

  • Horse DNA reveals how humans bred calm animals

    Horse DNA reveals how humans bred calm animals

    The story of how horses became calm enough to carry people is written in their DNA. A new study tracked ancient horse genomes across thousands of years and connected specific genetic changes to behavior and body shape.

    The work shows that early breeders first favored temperament, then selected for bodies that could handle speed, weight, and long travel.


    The research also pinpoints one region in the genome that appears to have tipped the balance toward rideability.

    Horses changed human life

    Xuexue Liu led the project at the Institute of Animal Science, Chinese Academy of Agricultural Sciences (CAAS), working with collaborators in France and Switzerland.

    Horses reshaped how people moved, traded, and fought. Archaeology and genetics place the successful spread of modern domestic horses in the Western Eurasian steppes a little over 4,000 years ago.

    A 2021 study linked the rise of horse domestication to new ways of moving across land using chariots and horseback.

    Before engines, horses were the fastest way to move people and goods. They also pulled plows and carried messages over long distances, which pushed cultures into closer contact.

    Those changes relied on animals that would accept a rider and keep pace without breaking down. The new genetic timeline helps explain how that happened step by step.

    Scanning horse DNA

    The researchers built a time series of horse DNA and scanned 266 trait linked markers tied to behavior and body conformation. They watched how those markers rose or fell in frequency as humans started managing horse breeding.

    They found clear signals that early selection focused on behavior. That pattern fits the simple idea that a trainable, steady animal is easier to handle before people attempt fast travel or combat.

    The team also defined several key terms that matter for reading the data. Ancient DNA refers to genetic material recovered from archaeological remains, and a genome is the full set of genetic instructions in an organism.

    A genetic locus is a specific location on a chromosome, and an allele is a version of a gene at that location. When an allele becomes more common because it helps survival or success under human choice, that rise is called positive selection.

    Gene linked to rideability

    One region named GSDMC stood out as the strongest candidate for rideability. The team reports that selection at this locus started about 4,750 years ago, with the period known as a domestication bottleneck marking a sharp shift in breeding.

    By about 4,150 years ago, variants in GSDMC had become very common in managed horse populations. The study links GSDMC genotypes to skeletal conformation in horses and to spinal anatomy, motor coordination, and muscular strength in mice.

    Those traits align with the demands of carrying a human across uneven ground for many miles. A stiffer, stronger back, coordinated movement, and adequate muscle power would all contribute to a safe, steady ride.

    The authors argue that selection on existing variation, not a brand new mutation popping up out of nowhere, likely fueled the rapid rise. That interpretation matches how breeders often work, choosing among the animals already in their herds.

    Calm horses chosen first

    The scan also flagged ZFPM1, a gene known to modulate behavior in mice, as showing positive selection roughly 5,000 years ago.

    The timing hints that calm temperament and tractability came before the body tweaks that made sustained riding possible.

    Taming an animal that is large, fast, and easily spooked would be the first hurdle. Once that gate is opened, people can begin to select for efficient movement and strength under load.

    Bronze to Iron Age changes

    The data suggest a shift in emphasis after the earliest phase of domestication. From the Iron Age onward, breeding leaned harder into larger body size and greater tameness to meet the demands of transport and warfare.

    That pattern mirrors the archaeological record that shows more widespread cavalry and heavier equipment later in time. Stronger, bigger horses would be better suited for those roles.

    Horse DNA shows change

    Time series genetics works because DNA from different ages acts like snapshots, and many snapshots form a timeline.

    With enough samples, researchers can watch allele frequencies move, which tells a story about selection pressure over centuries.

    The team cross-referenced genetic markers for behavior and body plan with known timelines for human mobility. That combination helps separate changes driven by people from natural drift, and it points to windows when breeding priorities changed.

    Why horse DNA gene matters

    GSDMC is a plausible hub because it influences how the spine and muscles develop and function. A back that holds form under a rider without undue flexion would reduce pain and injury risk for the animal.

    Coupled with better coordination and strength, the same horses could cross long distances at sustained paces. That capacity would give groups who bred and used them a real advantage in moving, trading, and waging war.

    Many questions remain

    The exact group or culture that first pushed rideability to center stage remains uncertain. The genetic clock narrows the window, yet it does not name the horse herders who made those early choices.

    Future work could refine which specific variants in GSDMC matter most and test how they affect motion in living horses.

    Ethical breeding today also has to balance performance with welfare, since back health is central to a horse’s quality of life.

    The study is published in the journal Science.

    —–

    Like what you read? Subscribe to our newsletter for engaging articles, exclusive content, and the latest updates. 

    Check us out on EarthSnap, a free app brought to you by Eric Ralls and Earth.com.

    —–

    Continue Reading

  • Species can evolve together without ever making contact

    Species can evolve together without ever making contact

    Evolution does not only respond to rivals, predators, or mates that bump into each other. It can also respond and evolve when ripples move through the environment and reach species that never cross paths, as shown in a new study.

    Researchers tracked a simple question with big consequences: Could one species change the evolution of another without ever meeting it face to face?


    The team studied indirect ecological effects, where one species influences another through a third species or by altering the environment rather than through direct contact. These effects can even cross habitat boundaries – as when land insects shape aquatic grazers – and, unlike obvious interactions such as predation or competition, they often go unnoticed.

    The study was led by Shuqing Xu at Johannes Gutenberg University Mainz and follows a long tradition of testing evolution in near-natural settings rather than only in small lab containers.

    Experimental ponds track evolution

    The researchers set up large outdoor mesocosms, which are controlled experimental ponds that mimic nature while allowing careful measurements. These systems were large enough to include many natural processes but controlled enough for clear tests.

    Each pond held about 4,000 gallons of water, plus aquatic plants, algae, and the tiny crustacean Daphnia. The researchers added aphids that feed on duckweed to some ponds and kept other ponds as controls without aphids.

    That created two worlds that never connected directly, since the aphids lived on floating macrophytes (larger aquatic plants like duckweed) while zooplankton and Daphnia (small drifting animals) as well as phytoplankton (microscopic algae) swam below.

    “We showed that land-based aphids influenced the evolution of Daphnia, a tiny aquatic crustacean, even though the two species never come into contact,” said Xu.

    The researchers carefully tracked environmental change and genetic change at the same time. The ponds allowed the team to connect cause to effect without guessing.

    Nutrients and heat shift

    When aphids heavily consumed duckweed, the floating plant thinned out. With less cover, more light penetrated the water, and pond phytoplankton flourished – providing extra food for Daphnia.

    The result was a sustained increase in Daphnia numbers in aphid ponds compared to controls, along with measurable shifts in nutrients and water temperature.

    For example, there was a roughly 71.5 percent jump in total phosphorus, plus higher underwater light and a small temperature rise.

    Species evolve under pressure

    Evolution leaves fingerprints in DNA. Whole genome sequencing showed that Daphnia in aphid ponds and Daphnia in control ponds diverged at many genomic sites, and the fraction of significantly different SNPs grew from one year to the next.

    Population divergence increased across the experiment, and the team identified more than one hundred variants with strong treatment differences.

    These genome-wide signals track with well-known resistance loci in Daphnia and support adaptive change in response to the altered environment.

    Adaptation came with a cost

    Transplant tests provided the decisive check on whether the observed genetic change was beneficial or just random drift.

    Daphnia that evolved in aphid ponds performed better back in aphid ponds than in control ponds.

    There was a trade-off: the same aphid-pond lineages performed worse when moved into control conditions, a classic cost of specialization that often follows rapid adaptation.

    Species shifts spark ripples

    The quality of algal food matters as much as the quantity. Some cyanobacteria provide poor nutrition – or are even harmful – for Daphnia, and their abundance shifted during the experiment.

    Independent studies explain why this matters: cyanobacteria are difficult for Daphnia to process and lack the key lipids the crustaceans need.

    These changes in the water column did not stop with Daphnia. They rippled outward, altering duckweed and boosting the growth of aphids, which thrived in ponds shaped by earlier herbivory.

    Such two-step echoes match ecological theory and show how evolutionary shifts in one part of an ecosystem can reverberate through others without direct contact.

    Species evolve across communities

    Ecologists have long suspected that networks of interaction, not just pairwise encounters, shape evolution.

    Past research shows that even species that do not interact directly can drive traits to evolve across mutualistic networks.

    Experiments with guppies offered early proof that adaptation changes whole ecosystems, not only the fish themselves – locally adapted fish altered nutrient cycling, algae, and other organisms around them.

    Daphnia add another layer to this picture. Far from being slow, they can respond to environmental change within just a few generations, and their genetic shifts ripple through communities.

    Modern genomics reveal how quickly Daphnia adapt to strong pressures, confirming that rapid evolution is not rare noise but a common feature of freshwater systems.

    The study is published in Proceedings of the National Academy of Sciences.

    —–

    Like what you read? Subscribe to our newsletter for engaging articles, exclusive content, and the latest updates. 

    Check us out on EarthSnap, a free app brought to you by Eric Ralls and Earth.com.

    —–

    Continue Reading