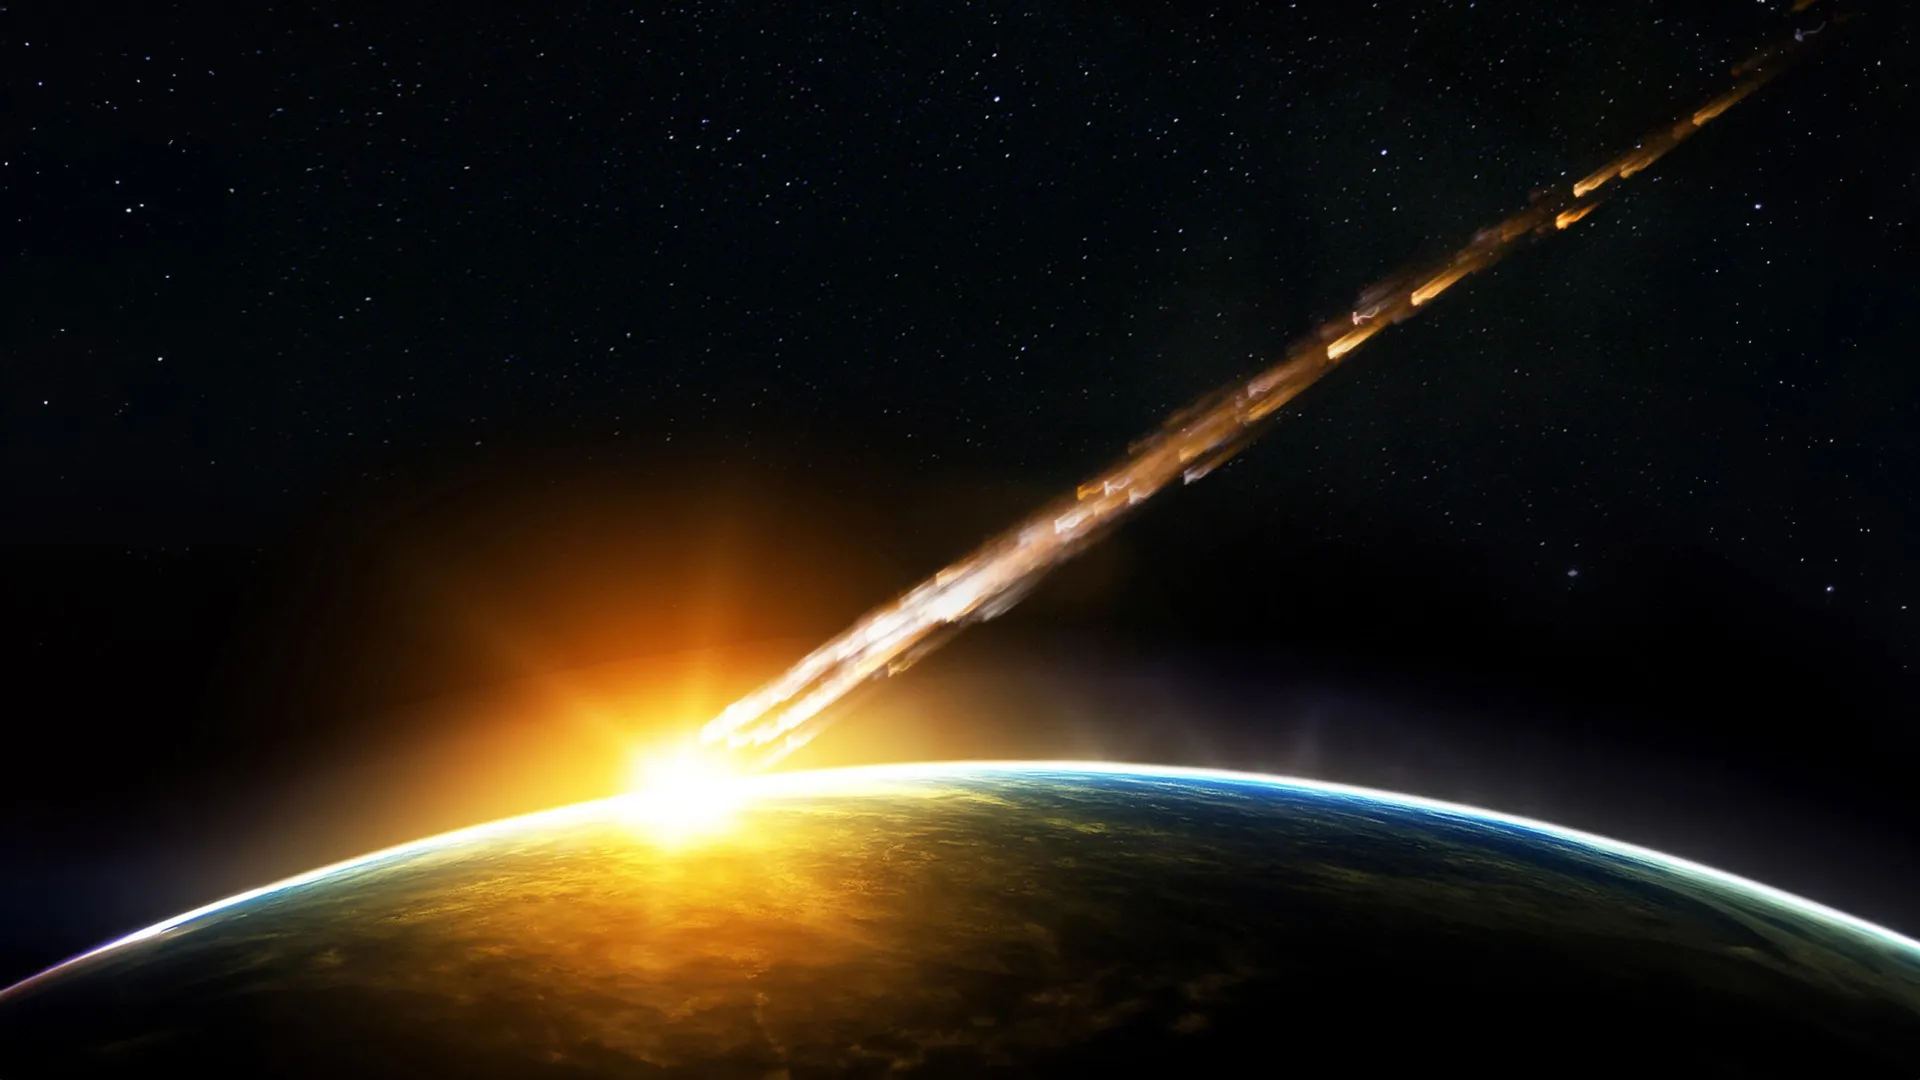
A long running scientific dispute about the origin of the Silverpit Crater beneath the southern North Sea has now been settled.
New research shows that the structure formed when an asteroid or comet struck the region roughly 43 to 46 million…
A long running scientific dispute about the origin of the Silverpit Crater beneath the southern North Sea has now been settled.
New research shows that the structure formed when an asteroid or comet struck the region roughly 43 to 46 million…
Hickey, M. & King, C. Common families of flowering plants 119–127 (Cambridge University Press, 1997).
Ramos Da Silva, L. R. et al. Lamiaceae essential oils, phytochemical profile,…
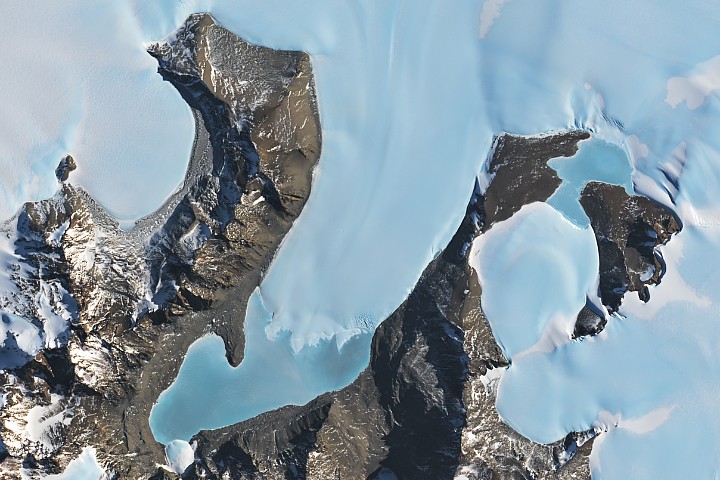
Scientists estimate that Earth is home to more than 100 million lakes. Among the most unusual is Lake Unter-See, one of Antarctica’s largest and deepest surface lakes, known for its distinctive water chemistry. Its ice-covered waters have…
Brennan, C. A. & Garrett, W. S. Fusobacterium nucleatum—symbiont, opportunist and oncobacterium. Nat. Rev. Microbiol. 17, 156–166 (2019).
Han, Y. W. Fusobacterium nucleatum: a…
Mar 11, 2026