Category: 7. Science
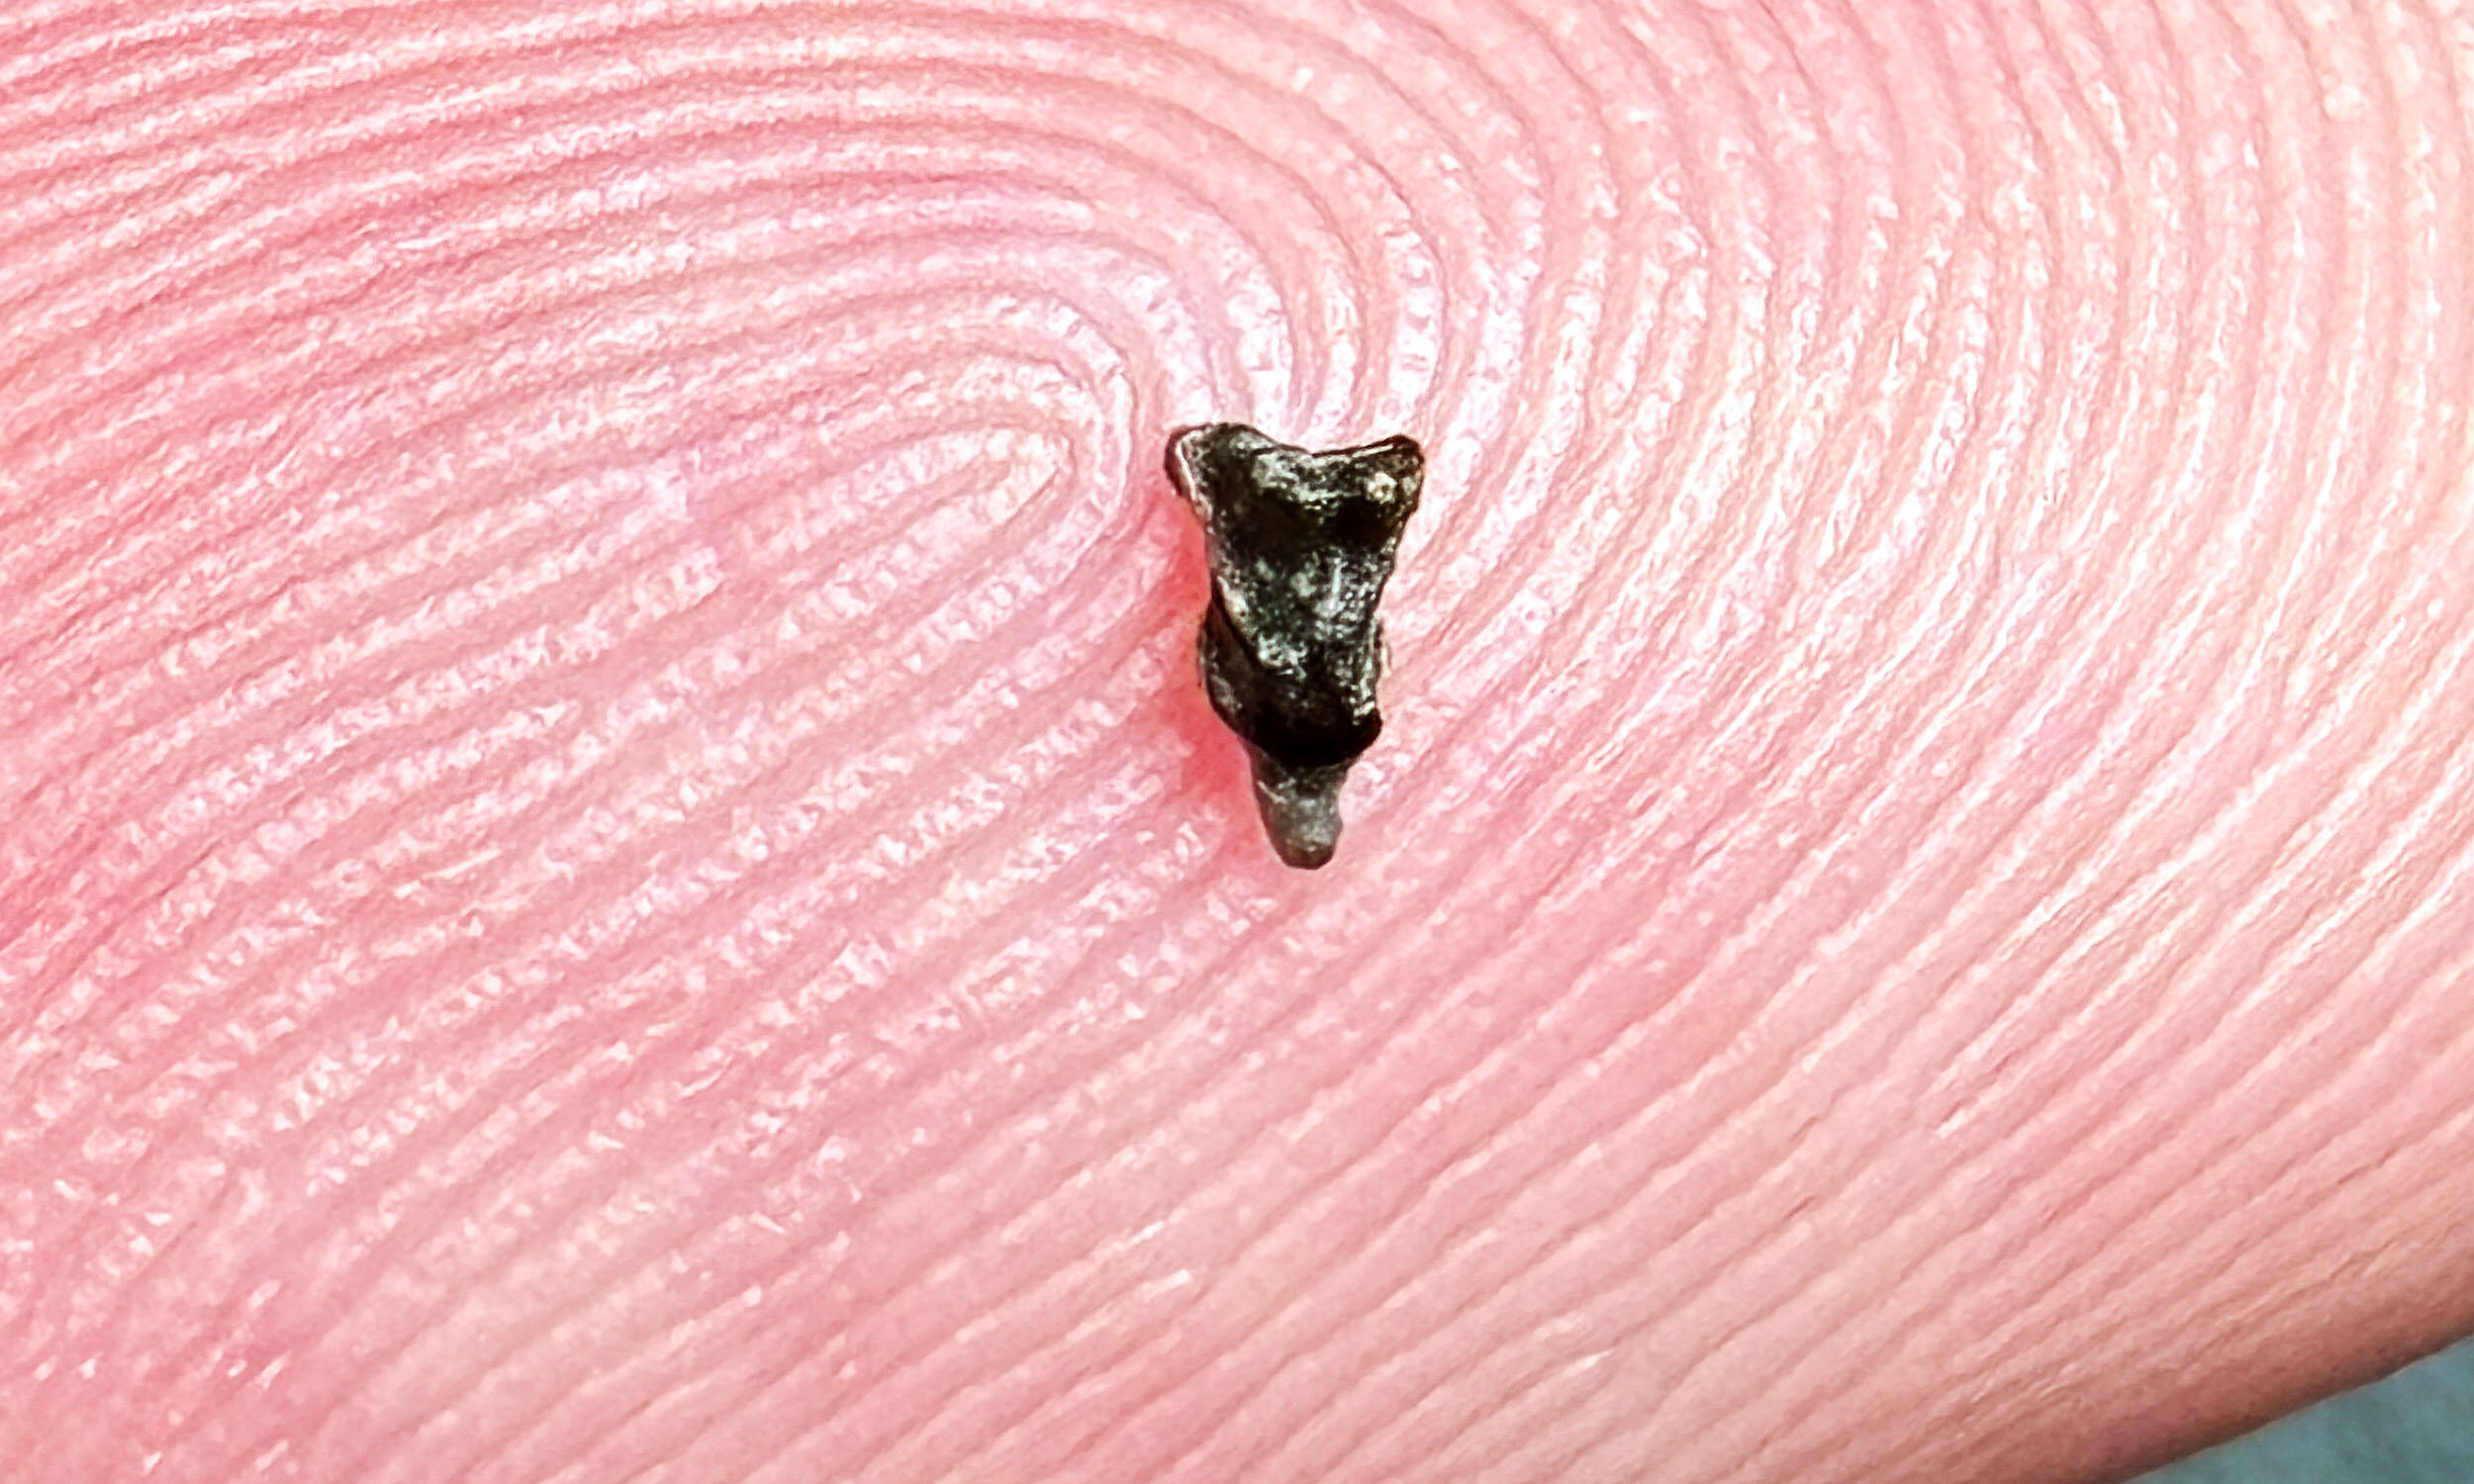
  • ‘Super alcohol’ in space: Why methanetetrol excites alien hunters

    ‘Super alcohol’ in space: Why methanetetrol excites alien hunters

    Methanetetrol has finally stepped out of theory and into the laboratory. The newly captured molecule, boasting four hydroxyl groups around one carbon, has long been the most evasive prey in prebiotic chemistry.

    Lead author Joshua Marks joined forces with astrochemist Ryan Fortenberry at the University of Mississippi, experimentalist Ralf Kaiser at the University of Hawaii at Mānoa, and computational modeler Alexander Mebel of Florida International University (FIU).


    Their cross-continental effort snared an ortho acid, a chemical family so crowded with oxygen that members usually self-destruct before anyone can measure them.

    Why scientists wanted methanetetrol

    Methanetetrol is the only known alcohol bearing four hydroxyl groups on a single carbon atom, placing it in a chemical group once thought too unstable to isolate.

    That singular architecture makes it an unusually sensitive marker for oxygen-rich reactions that may weave complex organics in cold space.

    For decades, textbooks carried drawings of the compound with a footnote that it had never been observed.

    Chemists could stabilize larger cousins by swapping the hydrogens for bulky groups, yet the bare-bones version always slipped away.

    The new experiment matters because hydroxyl tails are reactive handles that stitch simple molecules into sugars, acids, and nucleobase fragments.

    Catching the quadruple-hook variant sets a fresh benchmark for what sort of chemistry can occur on icy dust grains.

    By proving the molecule’s viability, the study widens the menu of compounds that telescopes should search for inside star-forming clouds.

    It also challenges long-standing rules that predicted any carbon with more than two hydroxyls would collapse back into a carbonyl.

    Recreating methanetetrol in space-like lab

    Kaiser’s group blasted a water-and-carbon-dioxide ice with electrons that mimic the secondary particles born of cosmic rays in space.

    Warming the frost then released trace gases that were hit with vacuum ultraviolet light, letting a time-of-flight mass spectrometer pick out methanetetrol ions.

    The ultraviolet photons carried just the right energy to knock an electron off the molecule without shattering it, a sweet spot calculated ahead of time by Mebel’s quantum models.

    Those calculations told the team which photon energies would leave a fingerprint fragment at mass-to-charge 63.

    Running the experiment with isotopically labeled ice, the researchers watched the fragment shift by exactly one atomic mass unit, confirming the identification.

    Control runs without electron irradiation showed no signal, proving that radiation is the spark that assembles the molecule in the frigid matrix.

    The method reproduces the slow cosmic chemistry that happens on interstellar dust over millions of years but compresses it into laboratory hours.

    It demonstrates that radical pathways can build surprisingly elaborate structures under deep-space conditions.

    Unstable but full of promise

    “This is essentially a prebiotic concentrate,” exclaimed Fortenberry after the isolation. He views the molecule as a tiny chemical starter that can grow complexity if the environment provides water, energy, and time.

    The catch is fragility: add a little heat and methanetetrol snaps into water, hydrogen peroxide, and other small oxidants. That volatility may be the very trait that makes it useful in the chemical relay race toward biomolecules.

    Each breakup injects oxygen-bearing fragments that can drive further reactions, influencing redox balance, pH, and even a planet’s atmosphere. In a young world, such bursts could steer surface chemistry toward greater complexity.

    In the laboratory, the molecule stayed intact only at cryogenic temperatures; room temperature spelled its demise.

    That limitation mirrors the conditions in dark molecular clouds, where thermometers hover near -430°F and molecules can linger for millennia.

    How methanetetrol moves in space

    Astronomers recently detected carbonic acid, a likely parent of methanetetrol, inside the Sagittarius B2 cloud near the Milky Way’s center.

    The discovery suggests that the raw materials for the new molecule already drift in regions that later collapse into stars and planets.

    If cosmic rays can trigger the same radical steps outlined in the lab, methanetetrol should form and then sublime as young protostars heat their envelopes. Radio telescopes tuned to its predicted rotational lines could now chase that signal.

    Because the molecule carries four oxygen atoms, its presence would mark locales where water ice and carbon dioxide intimately mix.

    Those sites are prime real estate for oxygen-driven chemistry, a prerequisite for everything from amino acids to ozone.

    Planetary researchers note that similar processes could unfold on comets and icy moons. Each time such a body swings closer to its star, trapped methanetetrol could vaporize and seed neighboring space with reactive fragments.

    Why the finding is important

    “The detection of the only alcohol with four hydroxyl groups at the same carbon atom pushes the experimental and detection capabilities to the ‘final frontier,’” said Kaiser, celebrating the technical leap.

    He stressed that refining both instruments and calculations was essential to catch such a fleeting target.

    The work plugs a gap in spectral databases used by observatories such as ALMA and JWST. Without a laboratory spectrum, telescopes can stare at a signal yet never identify the culprit.

    By adding methanetetrol and its ion fragments to those catalogs, researchers give observers a new tool for mapping oxygen-rich niches. Each fresh detection narrows the hunt for environments where chemistry inches toward biology.

    The breakthrough also shows that radical chemistry on ice can build molecules deemed impossible under Earth-like conditions.

    That insight is likely to shift funding toward more low-temperature radiation experiments across the astrochemistry community.

    What’s next for methanetetrol

    Marks says the next step is to search for methanetetrol in hot molecular cores, where its distinctive rotational lines should appear around 200 GHz. Laboratory microwave measurements are already under way to lock down those frequencies.

    Fortenberry’s group is also prospecting for heavier relatives in which one hydrogen is swapped for a methyl or amino group. Such derivatives could act as stepping-stones toward sugars or small peptides.

    Meanwhile, upcoming probes like Europa Clipper carry mass spectrometers capable of sniffing ejected plumes. If methanetetrol or its fragments appear there, they would spotlight active radiation chemistry beneath the moon’s ice.

    Every new detection stitches another thread into the tapestry of cosmic prebiotic chemistry, showing that even the most fragile molecules can survive long enough to reshape matter.

    The study is published in Nature Communications.

    —–

    Like what you read? Subscribe to our newsletter for engaging articles, exclusive content, and the latest updates. 

    Check us out on EarthSnap, a free app brought to you by Eric Ralls and Earth.com.

    —–

    Continue Reading

  • Stunning “wonder reptile” discovery rewrites the origins of feathers

    Stunning “wonder reptile” discovery rewrites the origins of feathers

    Body coverings such as hair and feathers have played a central role in evolution. They enabled warm-bloodedness by insulating the body, and were used for courtship, display, deterrence of enemies and, in the case of feathers, flight. Their structure is characterised by longer and more complex skin outgrowths that differ significantly from the simple and flat scales of reptiles. Complex skin outgrowths have previously only been observed in mammals in the form of hair and in birds and their closest fossil relatives, dinosaurs and pterosaurs, in the form of feathers. An international team led by palaeontologists Dr Stephan Spiekman and Prof Dr Rainer Schoch from the State Museum of Natural History Stuttgart, Germany, describes a previously unknown tree-dwelling reptile from the early Middle Triassic in a recent study published in the prestigious journal Nature. The 247-million-year-old reptile ‘Mirasaura grauvogeli’, whose name means ‘Grauvogel’s Wonder Reptile’, had a dorsal crest with previously unknown, structurally complex appendages growing from its skin with some similarities to feathers. The crest was probably used for display to other members of the same species. The find shows that complex skin structures are not only found in birds and their closest relatives but may predate modern reptiles. This important discovery forces us to reconsider our understanding of reptile evolution.

    Unique skin structures in early reptiles

    The crest of the rather small Mirasaura consists of individual, densely overlapping appendages that each possess a feather-like contour with a narrow central ridge. While real feathers consist of many delicate branched structures called barbs, there is no evidence of such branching in the appendages of Mirasaura. Because of this, the team believes that the structure of the complex, unique skin appendages of Mirasaura evolved largely independently of those of birds.

    ‘The fact that we have discovered such complex skin appendages in such an ancient group of reptiles sheds a new light on their evolution. Mirasaura is even older than the dinosaurs and not closely related to them. Developmental biology studies show that the genetic basis for the growth of complex skin appendages such as feathers probably originated in the Carboniferous period more than 300 million years ago. Mirasaura provides the first direct evidence that such structures actually did form early on in reptile evolution, in groups not closely related to birds and extinct dinosaurs,’ says Dr Stephan Spiekman, lead author of the paper and scientist at the State Museum of Natural History in Stuttgart.

    Dinosaurs and the origin of feathers

    The study marks a turning point in a nearly 30-year trend in palaeontological research that began with the discovery of feathered dinosaurs in China in the late 1990s. Before this time, it was thought that reptiles, including dinosaurs that gave rise to birds, were covered with scales and that only true birds had feathers. As a result, dinosaurs were often depicted as sluggish, scaly animals. This image changed when research started to show that many dinosaurs were much more bird-like than previously thought. The discovery of feathered, non-avian dinosaurs in China caused a wave of new studies that began to blur the lines between scaly, ‘cold-blooded’ reptiles on the one hand and feathered, ‘warm-blooded’ birds on the other. Now, it is clear that the story is even more complex.

    ‘Mirasaura grauvogeli shows us how surprising evolution can be and what potential it holds. It repeatedly produces similar structures that are completely independent of each other but also structures that are so different that they can be distinguished. Mirasaura developed an alternative to feathers very early in Earth’s history, long before the dinosaurs, which we did not expect and which will stimulate discussion and research,’ says Prof. Dr. Rainer Schoch, reptile expert and head of the Palaeontology Department at the State Museum of Natural History in Stuttgart.

    Bizarre tree-climbers with bird-like skulls and claws

    The latest technologies have been used to study Mirasaura, including synchrotron imaging carried out at the European Synchrotron (ESRF) to reconstruct the skull. This revealed a bird-like shape with a narrow, mostly toothless snout, large forward-facing eye sockets and a large, domed skull. The snout was probably used to extract insects from narrow tree holes. The drepanosauromorphs, to which Mirasaura belongs, are known to palaeontologists as extremely bizarre creatures of the Triassic period. They had grasping forelimbs, sometimes with a huge claw resembling that of a Velociraptor. They had long, barrel-shaped bodies, a long, prehensile tail, and hands that allowed them to grab onto branches like monkeys. Some species even had a hook-shaped claw at the tip of their tail for hanging from branches.

    ‘Drepanosaurs have many ecological adaptations and have only been known to science for a few decades. Mirasaura lived in trees in one of the first forests that emerged after the great mass extinction at the Permian-Triassic boundary. The dorsal crest with a novel skin structure in Mirasaura adds to the range of remarkable adaptations that make this group of reptiles so unique,’ says palaeontologist Prof Dr Hans Sues from the National Museum of Natural History, Washington DC, USA who participated in the new research.

    Melanosomes and skin structures

    A thin, brown film was partially preserved on the crest of Mirasaura. Analyses confirmed the presence of melanosomes, tiny organelles that contain melanin pigments. They are found in most animals, including humans. The researchers compared the shape of the Mirasaura melanosomes with those found in the skin of living reptiles, hair and feathers. ‘We know that in modern animals, melanosomes have specific morphologies linked to the tissue where they are found’ says Dr Valentina Rossi, a co-author of the study from University College Cork, Ireland, and an expert on fossil melanosome research. ‘the melanosomes found in Mirasaura soft tissues are more similar in shape to those found in extant and fossil feathers than melanosomes found in mammalian hair and reptilian skin.’

    Grauvogel’s ‘Wonder Reptile’

    Fossil collector Louis Grauvogel began excavating fossils from the Middle Triassicperiod in Alsace in the 1930s. Among his finds were fossils of Mirasaura. Over the years, he amassed an extensive collection, which remained in the Grauvogel family for many years. In 2019, the collection was transferred to the State Museum of Natural History in Stuttgart, where Mirasaura was discovered during further preparation. The fossils are in the palaeontological collection of the State Museum of Natural History Stuttgart.

    Mirasaura grauvogeli — Discovery story:

    Local fossil collector Louis Grauvogel began excavating in Alsace, France, in the late 1930s. The fossils he found dated back to the Middle Triassic period, around 247 million years ago, and consisted mainly of plants, insects and other invertebrates. Unknown to Grauvogel at the time, the finds included the remains of Mirasaura. The collection, which was highly regarded by researchers, remained largely in the family’s possession. Dr Léa Grauvogel-Stamm, a palaeobotanist and daughter of Louis Grauvogel, dedicated herself to researching and maintaining the collection. Dr. Grauvogel-Stamm is also involved in the study as a co-author. In 2019, the State Museum of Natural History Stuttgart, Germany, agreed with Dr Lea Grauvogel-Stamm to transfer the extensive collection to Stuttgart. There it will be available for research purposes and will also be on display to the public in future exhibitions. During the preparation of fossils from the Grauvogel Collection in Stuttgart, an unusual small reptile with a crest was discovered and further researched. In honour of its discoverer, Louis Grauvogel, the animal was named Mirasaura grauvogeli — ‘Grauvogel’s Wonder Reptile’. The fossil is now in the palaeontological collection of the State Museum of Natural History Stuttgart. An interdisciplinary team of palaeontologists wants to further investigate the site where Mirasaura grauvogeli was found to clarify why the skin outgrowths are so well preserved here. Future research will also focus on the ecology, biology and environment of Mirasaura, as well as its interactions with other animals.

    The research was funded by the DFG — Deutsche Forschungsgemeinschaft (German Research Foundation) and the European Research Council — Consolidator Grant. The State Museum of Natural History Stuttgart was able to acquire the Grauvogel collection several years ago with financial support from the Gesellschaft zur Förderung des Naturkundemuseums Stuttgart e.V., the Cultural Foundation of the German Federal States (Kulturstiftung der Länder) and the Ministry of Science, Research and the Arts Baden-Württemberg.

    Continue Reading

  • Dinosaur teeth reveal Jurassic CO2 levels and climate conditions

    Dinosaur teeth reveal Jurassic CO2 levels and climate conditions

    Dinosaur teeth are best known for their bite, yet new research says they also stored a chemical snapshot of prehistoric air. By probing that record, scientists have rebuilt carbon dioxide levels and plant productivity for the age of dinosaurs with a detail once thought impossible.

    The study comes from Dr. Dingsu Feng and colleagues at the University of Göttingen, the Johannes Gutenberg University Mainz (JGUM), and Ruhr University Bochum (RUB).


    Feng’s team focused on the Mesozoic Era, a span from 252 million to 66 million years ago when ecosystems ran hot and lush.

    Dinosaur teeth lock in ancient air

    The outer coat of a dinosaur’s tooth, made of durable tooth enamel, is harder than bone and shrugs off most chemical change.

    Inside that enamel sits a mix of oxygen atoms captured when the animal breathed and drank, effectively sealing in the atmosphere of its time.

    “Our method provides us with completely new insights into the Earth’s past,” stated Dr. Feng. He and his co-authors adapted a laboratory technique that separates the three natural oxygen isotopes in enamel to parts per million accuracy.

    Isotopes reveal past climate

    What they measured is called the triple oxygen isotope signal. A slight excess of the rare isotope in atmospheric oxygen rises when carbon dioxide climbs and falls when global plant growth, or gross primary productivity (GPP), surges.

    Because animals incorporate that signal through their body water, enamel preserves it like handwriting in stone. Earlier studies proved the idea in Cenozoic mammal teeth, but this is the first time it has been applied to dinosaurs.

    “The analysis of the three oxygen isotopes in dental enamel allows us to also measure the proportions of oxygen assimilated with respiratory air and drinking water,” explained Professor Thomas Tütken of Mainz. His remark highlights why enamel, not bone, became the sample of choice.

    Dinosaur teeth show CO₂ changes

    Results show Late Jurassic skies carried about 1,200 ppm of CO₂, roughly four times the pre industrial benchmark of 280 ppm. By the Late Cretaceous, CO₂ dipped to near 750 ppm, still three times today’s level.

    Certain Tyrannosaurus rex and Kaatedocus siberi teeth held isotope patterns that differ sharply from their peers. Those outliers hint at short lived CO₂ spikes, possibly tied to volcanic gas releases.

    High CO₂ sped plant growth

    Using published climate models, the team calculated that GPP in the Late Cretaceous ran almost double modern output. More CO₂ means photosynthesis can run faster, so forests and plankton likely pumped out extra oxygen while drawing down carbon.

    “The information obtained through our study on the global primary production provides important evidence of both marine and terrestrial food webs that would be otherwise difficult to obtain,” emphasized Professor Eva M. Griebeler of Mainz.

    Greater plant productivity could explain how giant herbivores found enough calories to thrive.

    High output also suggests rapid carbon cycling. Fast plant growth pulls CO₂ from air, but equally fast decay and volcanism can add it back, creating a dynamic greenhouse.

    Dinosaur teeth reveal volcano CO₂ spikes

    The isotope peaks coincide with the timing of eruptions in the Deccan Traps, a vast lava field in what is now India. Geochemical studies estimate the province vented more than 200,000 gigatons of CO₂ over a short geological window.

    Such gas surges could drive abrupt warming, reinforce monsoons, and disturb ocean chemistry. Some researchers see them as a prelude to the mass extinction that followed.

    Modeling studies of Deccan outgassing show that even moderate estimates of emitted carbon can lift global temperatures by several degrees Fahrenheit. The new tooth data provide a direct terrestrial check on those calculations.

    “Our teeth samples offer a previously missing land based puzzle piece,” Feng added. By pairing enamel records with marine proxies, scientists can now test how quickly air, sea, and life responded to volcanic jolts.

    Dinosaur teeth help study climate future

    Today’s CO₂ is racing past 420 ppm, still only a third of Late Jurassic values, yet the planet is already warming fast.

    That difference reminds us that continental layouts, ocean circulation, and solar input frame how sensitive the climate is to greenhouse gases.

    The method promises fresh looks at other deep time events, from Permian super greenhouses to ice house swings. It could also refine biogeochemical models that feed into future climate projections.

    Feng’s group is now collecting enamel from early mammals to chart CO₂ through the Paleocene Eocene Thermal Maximum, an analog for rapid warming driven by carbon release.

    If the technique holds up, museum drawers filled with fossil teeth may become a new archive for climate science.

    “Our work turns dinosaurs into climate experts,” Feng said with a grin. Their bites, it seems, still have plenty to teach.

    Image credit: Tooth of a Tyrannosaurus rex that was excavated in Alberta, Canada. Credit: photo/©: Thomas Tütken

    The study is published in Proceedings of the National Academy of Sciences.

    —–

    Like what you read? Subscribe to our newsletter for engaging articles, exclusive content, and the latest updates. 

    Check us out on EarthSnap, a free app brought to you by Eric Ralls and Earth.com.

    —–

    Continue Reading

  • Scientists just measured how fast glaciers carve the Earth

    Scientists just measured how fast glaciers carve the Earth

    Glaciers carved the deep valleys of Banff, eroded Ontario to deposit the fertile soils of the Prairies and continue to change the Earth’s surface. But how fast do glaciers sculpt the landscape?

    Published on August 7 in Nature Geoscience, University of Victoria (UVic) geographer Sophie Norris and her international team provide the most comprehensive view of how fast glaciers erode, and how they change the landscape. Most importantly, their research also provides an estimate of the rate of contemporary future erosion for more than 180,000 glaciers worldwide.

    Using a machine learning-based global analysis, Norris and her research team have worked to predict glacial erosion for 85 per cent of modern glaciers. Their regression equations estimate that 99 per cent of glaciers erode between 0.02 and 2.68 millimeters per year — roughly the width of a credit card.

    “The conditions that lead to erosion at the base of glaciers are more complicated than we previously understood,” says Norris. “Our analysis found that many variables strongly influence erosion rates: temperature, amount of water under the glacier, what kind of rocks are in the area, and how much heat comes from inside the Earth.”

    “Given the extreme difficulty in measuring glacial erosion in active glacial settings, this study provides us with estimates of this process for remote locations worldwide,” says John Gosse, Dalhousie University.

    Understanding the complex factors that cause erosion underneath glaciers is vital information for landscape management, long-term nuclear waste storage and monitoring the movement of sediment and nutrients around the world.

    Norris started this work while a post-doctoral fellow at Dalhousie and concluded it at UVic. The team of collaborators included the University of Grenoble Alpes (France), Dartmouth College (US), Pennsylvania State University (US) and the University of California Irvine (US). The work was carried out in partnership with and financially supported by the Canadian Nuclear Waste Management Organization.

    Continue Reading

  • Effect of intrapartum azithromycin on early childhood gut mycobiota development: post hoc analysis of a double-blind randomized trial

    Effect of intrapartum azithromycin on early childhood gut mycobiota development: post hoc analysis of a double-blind randomized trial

    Ethical approval

    The main trial (PregnAnZI-2) was approved by the Gambia Government-MRCG Joint Ethics Committee, the Comité d’Ethique pour la Recherche en Santé, the Ministry of Health of Burkina Faso, and the London School of Hygiene and Tropical Medicine Ethics Committee. In addition, this post hoc study was approved by the Gambia Government-MRCG Joint Ethics Committee and the London School of Hygiene and Tropical Medicine Ethics Committee. Study women signed informed consent for the trial during their antenatal visits and samples collected during the 4-months follow-up. An additional consent was sought from mothers of the study children for the 3-year survey.

    Study design

    PregnAnZI-2 (ClinicalTrials.org NCT03199547) was a phase-III, double-blind, randomized, placebo-controlled trial in which 11,983 women from The Gambia and Burkina Faso were randomized to receive a single dose of 2 g of oral azithromycin or placebo (ratio 1:1) during labor. The median time from administration of azithromycin to delivery was 1.6 h (IQR 0.5–4.1)9. Details of inclusion and exclusion criteria are available in the study protocol published elsewhere36. The primary objective of the trial was to evaluate the impact of the intervention on neonatal sepsis and death9. The trial showed no effect on the neonatal sepsis or death though other infections, including skin infections, were reduced in the azithromycin arm9. Also, the intervention reduced maternal infections including mastitis9.

    Here only participants from sites in The Gambia were included, where the trial was conducted in two health facilities located in the coastal region of the country. A subset of 253 mother-baby pairs were recruited in a bacterial carriage sub-study. These were randomly selected from study children born between January 2019 and March 202036. All the children in the carriage sub-study were vaginally delivered.

    Selection of children for mycobiota analysis

    The first 102 children recruited into the bacterial carriage sub-study in the Gambia were selected. For these children, an additional follow up was conducted at the age of 3 years, during which rectal swabs were collected from 72 of the 102 children initially selected plus an additional 25 children from the main carriage cohort. Details of the sample selection process is illustrated in Fig. 5. A total of 126 children were included in this mycobiota study. Fifty-seven of these children were born to mothers who received the active intervention (2 g azithromycin) and 69 were born to mothers who received placebo.

    Fig. 5: Study profile summarizing sample selection process.

    a Sample selection for mycobiota study. b Distribution of samples included in mycobiota analysis between trial arms at each time-point.

    Collection of rectal swabs

    During the trial, rectal swabs (RS) were collected with FLOQSwabs (COPAN, REF:519CS01) from the children included in the bacterial carriage sub-study. The first swabs were collected shortly after delivery (day 0). After post-delivery hospital discharge, active-follow up with home-visits occurred at day 6, day 28 and 4 months. RS were collected from the children during these follow-up visits. All the swabs were stored in skim milk-tryptone-glucose-glycerin (STGG) transport medium without preservative and transported in temperature-monitored (2–8 °C) cooler boxes with ice packs to the laboratory within 8 h. Upon reception, the samples were homogenized and stored at −80 °C for later processing.

    Rectal swabs used for mycobiota analysis

    A total of 467 RS from the children (214 azithromycin, 253 placebo) were processed. Sample numbers per time-point ranged from 40 to 46 for azithromycin arm and from 48 to 53 for placebo arm (Supplementary Table 1). As per best practice for microbiome studies, field controls were collected during the main study (PregnAnZI-2 trial) and during the year 3 follow up of children included in the microbiome studies. A vial of STGG with a plain sample collection swab immersed and exposed for approximately 1 min to the environment where participants were sampled, was used as a field control. To avoid contamination with fecal matter from the samples, the field controls were collected before the rectal swabs. A total of 109 field controls were collected, of which 12 were collected at the hospital sites during the main trial follow ups and 97 were collected from individual participant households during the year 3 follow up.

    DNA extraction and quality control

    We extracted DNA from the RS using the DNeasy® PowerLyzer® PowerSoil® Kit from Qiagen (Qiagen, Germany) with slight modifications as follows. A total of 100 µl of homogenized RS in 1 ml of STGG transport medium was used as input and two rounds of 10 cycles of beat beating at 2500 RPM for 30 s was applied with 10 min break between rounds. We followed the manufacturers protocol for the rest of the extraction steps and eluted in 100 µl of elusion buffer from Qiagen. Blank extraction and field controls were included and taken through all downstream analyses. Plain sterile swabs in sample storage vials with STGG exposed to the environment at the field site were included as field controls. The DNA extracts were quantified with a Qubit 4·0 Fluorometer (Invitrogen/Thermo Fisher Scientific) using the double stranded DNA high-sensitive kit.

    ITS2 library preparation and sequencing

    ITS2 amplicons were generated using the following primers (forward: GTGAATCATCGARTCTTTGAAC, reverse: TATGCTTAAGTTCAGCGGGTA) published elsewhere37, and the Q5 Hi-Fi 2X master mix from New England Biolabs (NEB). The PCR reaction was set up with 12.5 µl of master mix, 1 µl each of forward and reverse primers at 10 µM concentration, 5 µl of template, and 5.5 µl of molecular grade water. The following thermocycling conditions were used. Initial denaturation at 98 °C for 30 s, followed by 35 cycles of denaturation at 98 °C for 20 s, annealing at 51 °C for 30 s, and extension at 72 °C for 20 s. This was followed by a final extension at 72 °C for 10 min. The expected amplicon size was ~350 bp. Post PCR DNA concentrations were quantified as described earlier. The PCR products where then normalized to 50 ng (~200 fmol) in 12.5 µl for library preparation. Nanopore libraries were made using the ligation sequencing kit (SQK-LSK109) with the native barcoding expansion 96 (EXP-NBD196) using manufacturers protocol. Six pools of 96 libraries and 1 pool of 39 libraries were generated including rectal samples, field controls, extraction reagent blanks and PCR reagent blanks. Each pool was sequenced using an R9 MinION flow cell (FLO-MIN106D) on a GridION using quality filters of 200 bp minimum read length and minimum quality score of Q9. Between 4 million to 8 million reads were generated for each of the 96 library pools, and about 400,000 reads were generated for the pool of 39 libraries, which were mostly field controls.

    Analysis of ITS2 sequences

    The sequence data were analyzed using NanoCLUST38, a pipeline designed for analyzing 16S rRNA gene amplicon data generated on the Oxford Nanopore Technology (ONT) sequencing platform. The pipeline was optimized for analyzing ITS2 data generated on the ONT sequencing platform. The pipeline takes in raw FASTQ files and performs trimming and filtering using fastp39. Reads were filtered by minimum Q-score of 9 and read lengths between 200 bp and 500 bp. It then generates k-mer frequencies and performs clustering using UMAP-HDBSCAN40,41. We subsampled up to 5000 reads per sample for clustering setting minimum cluster size at 50 and minimum distance to define a cluster at 0.1. Sequences in each cluster are then corrected using Canu assembler42. This is followed by the selection of draft representative sequences for each cluster, which are subsequently polished using Racon43, and Medaka44. The polished consensus sequences are then classified using Kraken245, with a subset of the standard Kraken2 database (April 2024 version) containing only fungal and human sequences.

    Mycobiota community analysis

    Classification data generated with NanoCLUST were imported into R (version 4.4.0) and RStudio (version 2024.04.1 + 748)46, for further microbial community analysis. The Tidyverse (version 2.0.0), and phyloseq (version 1.48.0)47, packages were mainly used for data handling and organization. First, taxon counts were normalized by total sum scaling. We then inspected the initial profiles of the samples and controls to see the relative abundances of human and unclassified reads as well as possible contaminants (Supplementary Fig. 1). Most of the reads in the PCR and extraction blanks were unclassified, and the top two taxa in the rectal swabs were unclassified and human (Supplementary Fig. 1). We filtered out all human and unclassified reads. The filtered dataset was transformed into a feature table and used to create a phyloseq object together with the sample metadata. Using decontam (version 1.20.0)48, we identified contaminants in the dataset using the isContaminant function in the combined mode setting a probability cutoff of 0.2 for calling a contaminant. A total of 18 taxa (Supplementary Table 2) were identified as contaminants and filtered from the dataset. We re-inspected the profiles of the samples and controls again to see how they have been impacted by the filtering. Most of the potential contaminants were removed, though there still remained a couple of other potential contaminants (Aspergillus fumigatus and Aspergillus puulaauensis) which were subsequently filtered out (Supplementary Fig. 2). Details on the sample numbers that were available before and after all the filters were applied are shown in Supplementary Table 1. The number of reads in the samples and controls before and after filtering of unclassified, human, and contaminants are shown in Supplementary Fig. 3. Samples with only 1 or 2 species (not read counts) remaining post-filter were excluded from analyses of community composition, clustering, and differential abundance to avoid outlier effects.

    Before measuring the effects of the intervention on the mycobiota, we first assessed the trial arms for comparability at baseline. Variables that had different representation between the trial arms were controlled for during statistical analysis.

    We measured diversity within individual samples (alpha diversity) using Shannon index and species richness. To understand the effects of potential factors that influence microbiome diversity, we assessed the effects of treatment, ethnicity, season of sampling, parity, and sex (sex was determined at birth) among others as covariates on Shannon diversity and species richness using a linear mixed effects model with a random effect on subject. Based on this model we examined interaction between treatment and season measuring variation of Shannon diversity between trial arms at each time-point by season using Wilcoxon rank sum test. The season stratified analysis did not include samples collected at the age of 3 years because all the samples at this time point were collected during the wet season. We also examined interaction between treatment and parity in a similar analysis. Finally, we assessed the effect of age on Shannon diversity using a linear mixed effects model, comparing day 0 to each of the subsequent time-points while controlling for treatment, season of sampling, ethnicity, parity and sex and adding individual variations as random effects. p values were adjusted for repeated testing by Dunnett’s test.

    Overall community composition was measured with Bray–Curtis index using the vegdist function in vegan (version 2.6.4)49. Variance in community composition was compared between groups by permutational multivariate analysis of variance (PERMANOVA) using the adonis function in vegan. We assessed the effects of age, season of sampling, ethnicity, parity, and sex on overall community composition within each trial arm. For age comparisons, we compared variance across all time-points and then between day 0 and each of the subsequent time-points. We then compared variance in community composition by treatment by comparing trial arms at each time-point. As we did not find any significant variation in community composition by sampling season, parity, ethnicity, or sex, no stratified analysis was done for these variables.

    To further explore the structure of the gut fungal community in our cohort, we employed an unsupervised clustering using Dirichlet’s Multinomial Mixtures model implemented in mothur (version 1.44.0)50, to group samples into clusters based on their community types. We used logistic regression to examine association between fungal clusters (grouped as dominant community type which we called fungCluster_3 vs others) and covariates including treatment, age, sampling season, and parity. We visualized the profiles of the clusters using a heatmap to see which taxa were driving the separation of samples and summarized the frequencies of the clusters per time-point for each trial arm. To understand the dynamics of changes in fungal community types, we assessed the transition of individual children through the different clusters over time.

    We assessed variations in taxon abundance using linear models implemented in MaAsLin2 (version 1.18.0)51. First, we assessed temporal variations in taxon abundance between the trial arms at each time-point. We then assessed differences in taxon abundance between trial arms by season of sampling. Finally, we assessed overall abundance for each taxon by treatment, age, season of sampling, parity, ethnicity, sex, and bacterial cluster, while adjusting for random effects on subject. Only taxa with minimum abundance and variance of at least 0.01% were included in differential abundance analysis. p values were adjusted for multiple testing and an FDR cutoff of 0.2 was used for calling significance. We used bacterial clusters identified in these children from our previous study22, where we characterized gut microbiota development to identify potential associations of the bacterial community types with the abundance of individual fungal taxa. Bacterial clusters identified in the children at day 28 were used as this was the point at which we saw marked differences in the representation of bacterial community types between the trial arms22. Data on the bacterial clusters assigned to individual samples is provided in Supplementary Data 152.

    Statistics and reproducibility

    Sample size for each trial arm at baseline is shown in Table 1. Demographic comparability of the trial arms at baseline was assessed using various tests. For categorical variables (ethnicity, sex, season, breastfeeding mode) except for recent sickness and recent antibiotic consumption, Chi-square test was applied. For recent sickness and recent antibiotic consumption, Fisher’s exact test was applied. For continuous data (maternal age, birthweight, breastfeeding duration), t-test was applied.

    The sample size was originally calculated for gut microbiota analysis. We chose to work with the same set of samples because we intended to link our findings with the results we obtained from the gut microbiota analysis. The sample size calculation was based on power to detect at least 10% difference in the top 10 operational taxonomic units (OTUs) and 20% difference in the next 10 OTUs in the gut microbiota using a sample size and power calculation tool for case-control microbiome study design developed by Mattiello et al. 53. We used the gut microbiome dataset from the human microbiome study embedded in the tool. With a sample size range of 30–70 per group, we estimated power by Monte Carlo simulations with 100 replications using the top 50 OTUs from the dataset. A sample size of 45 per group at each time-point had over 90% power to detect these differences. Though we expect higher interpersonal variations with the gut mycobiota than the gut microbiota, our analysis factored this by exclusion of outliers in comparisons of community composition and differential taxon abundance. The remaining samples used in each of these analyses are shown in the respective results.

    Multivariate analysis of factors that influenced alpha diversity was done using a linear mixed effects model with random effects on individuals. Temporal variations in alpha-diversity between trial arms was assessed at each time-point by Wilcoxon Rank Sum test. Changes in Shannon diversity over time was assessed using a linear mixed effects model including ethnicity, season, parity, and sex as covariates in addition to the trial treatment while controlling for random variations among individuals. p values were adjusted by Dunnett’s test.

    Beta-diversity was compared between trial arms at each time-point by permutational multivariate analysis of variance (PERMANOVA) using the adonis function in vegan49. Beta-diversity was also compared by age across timepoints using the adonis function with permutations restricted within individuals.

    Differential taxon abundance was assessed using generalized linear models implemented in MaASLin251. Temporal differences between trial arms were assessed at each time. Variations by age and other covariates were assessed with the aggregated data.

    Analysis of factors that drive mycobiota community-types was done by logistic regression using a generalized linear model.

    Reporting summary

    Further information on research design is available in the Nature Portfolio Reporting Summary linked to this article.

    Continue Reading

  • 332 colossal canyons just revealed beneath Antarctica’s ice

    332 colossal canyons just revealed beneath Antarctica’s ice

    Submarine canyons are among the most spectacular and fascinating geological formations to be found on our ocean floors, but at an international level scientists have yet to uncover many of their secrets, especially of those located in remote regions of the Earth like the North and South Poles. Now, an article published in the journal Marine Geology has brought together the most detailed catalogue to date of Antarctic submarine canyons, identifying a total of 332 canyon networks that in some cases reach depths of over 4,000 meters.

    The catalogue, which identifies five times as many canyons as previous studies had, was produced by the researchers David Amblàs, of the Consolidated Research Group on Marine Geosciences at the Faculty of Earth Sciences of the University of Barcelona, and Riccardo Arosio, of the Marine Geosciences Research Group at University College Cork. Their article shows that Antarctic submarine canyons may have a more significant impact than previously thought on ocean circulation, ice-shelf thinning and global climate change, especially in vulnerable areas such as the Amundsen Sea and parts of East Antarctica.

    Submarine canyons: the differences between East and West Antarctica

    The submarine canyons that form valleys carved into the seafloor play a decisive role in ocean dynamics: they transport sediments and nutrients from the coast to deeper areas, they connect shallow and deep waters and they create habitats rich in biodiversity. Scientists have identified some 10,000 submarine canyons worldwide, but because only 27% of the Earth’s seafloor has been mapped in high resolution the real total is likely to be higher. And despite their ecological, oceanographic, and geological value, submarine canyons remain underexplored, especially in polar regions.

    “Like those in the Arctic, Antarctic submarine canyons resemble canyons in other parts of the world,” explains David Amblàs. “But they tend to be larger and deeper because of the prolonged action of polar ice and the immense volumes of sediment transported by glaciers to the continental shelf.” Moreover, the Antarctic canyons are mainly formed by turbidity currents, which carry suspended sediments downslope at high speed, eroding the valleys they flow through. In Antarctica, the steep slopes of the submarine terrain combined with the abundance of glacial sediments amplifies the effects of these currents and contributes to the formation of large canyons.

    The new study by Amblàs and Arosio is based on Version 2 of the International Bathymetric Chart of the Southern Ocean (IBCSO v2), the most complete and detailed map of the seafloor in this region. It uses new high-resolution bathymetric data and a semi-automated method for identifying and analysing canyons that was developed by the authors. In total, it describes 15 morphometric parameters that reveal striking differences between canyons in East and West Antarctica.

    “Some of the submarine canyons we analyzed reach depths of over 4,000 meters,” explained David Amblàs. “The most spectacular of these are in East Antarctica, which is characterized by complex, branching canyon systems. The systems often begin with multiple canyon heads near the edge of the continental shelf and converge into a single main channel that descends into the deep ocean, crossing the sharp, steep gradients of the continental slope.”

    Riccardo Arosio noted that “It was particularly interesting to see the differences between canyons in the two major Antarctic regions, as this hadn’t been described before. East Antarctic canyons are more complex and branched, often forming extensive canyon-channel systems with typical U-shaped cross sections. This suggests prolonged development under sustained glacial activity and a greater influence of both erosional and depositional sedimentary processes. In contrast, West Antarctic canyons are shorter and steeper, characterized by V-shaped cross sections.”

    According to David Amblàs, this morphological difference supports the idea that the East Antarctica Ice Sheet originated earlier and has experienced a more prolonged development. “This had been suggested by sedimentary record studies,” Amblàs said, “but it hadn’t yet been described in large-scale seafloor geomorphology.”

    About the research, Riccardo Arosio also explained that “Thanks to the high resolution of the new bathymetric database — 500 meters per pixel compared to the 1-2 kilometres per pixel of previous maps — we could apply semi-automated techniques more reliably to identify, profile and analyse submarine canyons. The strength of the study lies in its combination of various techniques that were already used in previous work but that are now integrated into a robust and systematic protocol. We also developed a GIS software script that allows us to calculate a wide range of canyon-specific morphometric parameters in just a few clicks.”

    Submarine canyons and climate change

    As well as being spectacular geographic accidents, the Antarctic canyons also facilitate water exchange between the deep ocean and the continental shelf, allowing cold, dense water formed near ice shelves to flow into the deep ocean and form what is known as Antarctic Bottom Water, which plays a fundamental role in ocean circulation and global climate.

    Additionally, these canyons channel warmer waters such as Circumpolar Deep Water from the open sea toward the coastline. This process is one of the main mechanisms that drives the basal melting and thinning of floating ice shelves, which are themselves critical for maintaining the stability of Antarctica’s interior glaciers. And as Amblàs and Arosio have explained, when the shelves weaken or collapse, continental ice flows more rapidly into the sea and directly contributes to the rise in global sea level.

    Amblàs and Arosio’s study also highlights the fact that current ocean circulation models like those used by the Intergovernmental Panel on Climate Change do not accurately reproduce the physical processes that occur at local scales between water masses and complex topographies like canyons. These processes, which include current channeling, vertical mixing and deep-water ventilation, are essential for the formation and transformation of cold, dense water masses like Antarctic Bottom Water. Omitting these local mechanisms limits the ability that models have to predict changes in ocean and climate dynamics.

    As the two researchers conclude, “That’s why we must continue to gather high-resolution bathymetric data in unmapped areas that will surely reveal new canyons, collect observational data both in situ and via remote sensors and keep improving our climate models to better represent these processes and increase the reliability of projections on climate change impacts.”

    Continue Reading

  • Earths natural weathering system removes millions of tons CO2

    Earths natural weathering system removes millions of tons CO2

    Natural processes on land and in the ocean already remove carbon dioxide from the air, but they do not work in isolation. A new paper argues that these processes must be seen as one connected system, a weathering continuum that stretches from high terrain to the deepest seabed and controls how much CO2 is locked away over time.

    This perspective matters because many climate ideas aim to speed up weathering to pull more CO2 from the atmosphere. If the pieces of the chain are tightly linked, pushing on one part can tug on another in ways that help or hurt the total carbon removed.

    Why linking land and ocean matters


    Dr. Gerrit Trapp-Müller of the Georgia Institute of Technology led the study, which was completed during his time at Utrecht University.

    The team brings reactions in soils, rivers, coasts, and marine sediments into one model so we can view the whole system, not just scattered parts.

    In this framework, the direction and size of a local flux depend on the material’s origin, how it has been transported and altered, and the surrounding conditions. That is a practical shift, because it changes how we should place, size, and verify interventions meant to boost carbon removal.

    How silicate weathering stores CO2

    At the center is silicate weathering – the set of reactions where acidic water breaks down silicate minerals, releasing cations and bicarbonate that ultimately store carbon as carbonate minerals.

    Over geologic time, silicate weathering acts as a negative feedback that steadies climate by consuming more CO2 as temperatures rise.

    This thermostat effect is real but slow on human timescales. It scales with factors such as temperature, runoff, rock type, and how quickly fresh mineral surfaces are exposed.

    Oceans can release CO2

    There is a twist called reverse weathering. In marine sediments, the formation of authigenic clays can consume alkalinity, release acidity, and shift carbon back toward the atmosphere.

    When reactions that consume alkalinity dominate parts of the chain, the net sink can shrink or even flip. That means the ocean side of the system can throttle what the land side achieves.

    Not all settings pull equal weight. Recent work highlights deltas and beaches as marine weathering hotspots that can shape the balance between forward and reverse reactions along the transport path from rivers to the shelf and beyond.

    Studies in delta muds, using both field data and models, show that where the sediment comes from and how it was deposited determine whether chemical reactions add or remove alkalinity – and by how much – at different depths and over time. These factors decide whether the area is a strong sink or only a weak one.

    How much CO2 weathering removes

    So how much carbon does chemical weathering handle today. A global analysis finds total CO2 consumption by chemical weathering near 237 million metric tons of carbon per year, with silicates accounting for roughly 63 percent of that budget, on the order of 149 million tons of carbon annually.

    Within the silicate share, basaltic terrains have an outsized impact, contributing on the order of 25 to 35 percent of the silicate weathering CO2 sink because they weather quickly where runoff is high.

    That concentration of flux in a small fraction of the landscape explains why placement of interventions matters so much.

    How we could boost weathering

    Analyses suggest that spreading finely crushed silicate rock on croplands could remove on the order of 0.5 to 2.0 billion tons of CO2 per year, comparable to other land-based options if done at scale and with the right logistics.

    This is a large range, and it depends on climate, soils, farm practices, and supply chains.

    Recent evaluations also warn that removal efficiency varies widely and can be overestimated if you ignore side fluxes, carbonate dynamics, or downstream processes in the ocean that offset gains on land. Measuring the whole chain is not optional, it is the only way to know the real net.

    The future of weathering research

    “The main conclusion from our work is that the various CO2 fluxes on land and in the ocean are very closely linked. This governs the efficiency of the removal of CO2 from the atmosphere,” said Trapp-Müller.

    Treating weathering as one system forces three practical habits. Site selection should consider downstream coupling, monitoring must track products beyond the field edge, and models need to include both forward and reverse reactions across environments.

    Future studies may map which river basins, coastlines, and sedimentary settings deliver the biggest net gains once ocean processes are included. That includes quantifying how fast material moves along the conveyor from hills to seabed and how reaction balances change en route.

    The new perspective also invites better stress tests for proposed projects, from agricultural basalt applications to coastal alkalinity additions, against the actual carbon accounting of the full chain. 

    The study is published in the journal Nature Geoscience.

    —–

    Like what you read? Subscribe to our newsletter for engaging articles, exclusive content, and the latest updates. 

    Check us out on EarthSnap, a free app brought to you by Eric Ralls and Earth.com.

    —–

    Continue Reading

  • Women’s egg cells shield DNA from the effects of aging

    Women’s egg cells shield DNA from the effects of aging

    For decades, scientists assumed that as women age, their egg cells collect genetic damage, just like the rest of the body. But new research suggests that human eggs might be playing by their own rules.

    In a study spanning women aged 20 to 42, researchers discovered that the tiny power plants inside our cells – mitochondria – keep their genetic material remarkably pristine in eggs, even as the years pass.


    These same energy makers in blood and saliva do pick up more damage with age. But in eggs? The mutation rate barely budges.

    “When we think about age-related mutations, we think about older people having more mutations than younger people,” said Kateryna Makova at Penn State University. “But expectation is not necessarily the truth.”

    Women’s eggs store clean DNA

    Mitochondria pass exclusively from mother to child. Their DNA is short, circular, and essential for making energy. Damage to it can sometimes trigger devastating disorders, especially in tissues with high energy demands like muscles and the brain.

    “The oocyte [egg] provides this stockpile,” said Ruth Lehmann, professor of biology at the Massachusetts Institute of Technology, referring to the generous stash of mitochondria inside each egg cell.

    To see how these precious packages fare over time, the team used a cutting-edge method called duplex sequencing. It can spot even the rarest mutations – changes present in less than one percent of a cell’s mitochondrial copies.

    This was no small undertaking: they sequenced 80 single eggs, plus blood and saliva samples, from 22 women.

    Eggs resist aging mutations in women

    The study revealed a clear difference between eggs and other tissues. Blood and saliva from older women contained more mitochondrial mutations than those from younger women, showing the expected age-related increase.

    Egg cells, however, showed no such rise. In fact, they consistently had 17 to 24 times fewer mutations than blood or saliva, regardless of the woman’s age.

    Within the mitochondrial genome, vulnerability was uneven. In eggs, most mutations appeared in the D-loop, a noncoding control region, while the crucial protein-coding sections remained mostly untouched.

    This pattern points to a protective mechanism that directs genetic changes away from regions essential for energy production.

    By protecting these critical genes, eggs help preserve the functional integrity of mitochondria, ensuring they can perform their energy-supplying role for decades. This built-in protection could be a key reason eggs maintain reproductive potential well into later stages of a woman’s life.

    Natural filter removes harmful DNA

    A woman may inherit some mitochondrial DNA variants from her mother, which then appear in both her eggs and other tissues. These shared variants, called inherited heteroplasmies, often exist at lower levels in eggs than in blood or saliva.

    This difference points to a natural quality-control system within the reproductive process that reduces potentially harmful mitochondrial changes before they are passed to future generations.

    Researchers also measured the “germline bottleneck” – the sharp reduction in the number of mitochondrial DNA copies that are actually transmitted during egg development. This bottleneck acts as a filter, determining which variants survive to the next generation.

    For high-frequency variants, the team estimated the bottleneck size to be around 30 mitochondrial DNA units, which is consistent with earlier findings from family-based genetic studies.

    This small number helps explain how reproduction can effectively minimize harmful mutations, protecting offspring from potential mitochondrial disorders.

    Unlocking fertility’s genetic secret

    The study challenges the long-held assumption that egg cells deteriorate genetically in step with the rest of the body. Instead, they appear to have protective systems that guard their mitochondrial DNA well into a woman’s reproductive years.

    “I think that we evolved a mechanism to somehow lower our mutation burden, because we can reproduce later in life,” said Makova.

    It’s a finding with big implications. If we can understand – and maybe even mimic – this natural preservation system, we might unlock new ways to improve fertility treatments and reduce the risk of passing on mitochondrial disorders.

    For now, the message is surprisingly optimistic: while the rest of the body’s cells may bear the marks of time, women’s eggs seem to have found a way to keep part of their genetic story young.

    The study is published in the journal Science Advances.

    —–

    Like what you read? Subscribe to our newsletter for engaging articles, exclusive content, and the latest updates. 

    Check us out on EarthSnap, a free app brought to you by Eric Ralls and Earth.com.

    —–

    Continue Reading

  • Viral Myanmar Earthquake Video Shows First Visual Evidence of Rare Seismic Phenomena

    Viral Myanmar Earthquake Video Shows First Visual Evidence of Rare Seismic Phenomena

    In May, we reported on a first-of-its-kind video that captured surface rupture during Myanmar’s devastating 7.7 magnitude earthquake. While the YouTube video now has 1.6 million views, two geophysicists spotted something many people probably didn’t notice.

    The video seems like a gift that just keeps on giving. As the Kyoto University scientists explain in a study published last month in The Seismic Record, it also includes the first direct visual evidence of pulse-like rupturing and a curved fault slip. This means the two sides of the strike-slip fault didn’t just slip horizontally past each other—the slip path also dipped downward. While scientists have previously inferred both features from seismic data and post-earthquake observations and seismic data, the video provides direct visual evidence.

    “Our results provide the first direct visual evidence of curved coseismic fault slip, bridging a critical gap among seismological observations, geological data, and theoretical models,” the researchers wrote in the study.

    You might be wondering how the researchers inferred all that from a very brief video excerpt. The answer is that they analyzed Myanmar’s Sagaing Fault’s movement in the footage frame-by-frame. With this approach, they discovered that the fault slipped sideways 8.2 feet (2.5 meters) in 1.3 seconds, with a peak speed of 10.5 feet (3.2 meters) per second.

    While the earthquake’s entire sideways movement was normal for strike-slip events, “the brief duration of motion confirms a pulse-like rupture, characterized by a concentrated burst of slip propagating along the fault, much like a ripple traveling down a rug when flicked from one end,” Jesse Kearse, a co-author of the study from Kyoto University, said in a university statement.

    Kearse and co-author Yoshihiro Kaneko’s analysis also revealed that the fault’s slip path was slightly curved. This finding aligns with curved slickenlines—scratches caused by rocks scraping against each other along a fault—that earthquake geologists often find after earthquakes. The video provides the first visual proof of the curved slip behind the striations.

    “Instead of things moving straight across the video screen, they moved along a curved path that has a convexity downwards, which instantly started bells ringing in my head,” Kearse explained in a statement by the Seismological Society of America. “The dynamic stresses of the earthquake as it’s approaching and begins to rupture the fault near the ground surface are able to induce an obliquity to the fault movement,” he adds. “These transient stresses push the fault off its intended course initially, and then it catches itself and does what it’s supposed to do, after that.”

    More broadly, the Myanmar earthquake’s north-to-south rupture confirms the researchers’ previous conclusion that slip curvature types depend on the direction of said rupture. Accordingly, earthquake scientists can study slickenlines to understand bygone earthquakes, potentially informing future risks.

    “Together these findings impose critical observational constraints on future rupture simulations,” the researchers conclude in the study, “and deepen our understanding of the physical mechanisms that control rapid fault slip during large earthquakes.”

    Continue Reading

  • Quantum freezing at room temperature locks nanoparticle at 92% purity

    Quantum freezing at room temperature locks nanoparticle at 92% purity

    The intriguing rules of quantum physics almost always fail when you move from atoms and molecules to much larger objects at high temperatures. 

    This is because the bigger an object gets and higher the temperature is, the harder it becomes to stop it from interacting with surroundings, a phenomenon that usually erases the delicate quantum behavior. 

    However, a new study has managed something that seriously pushes these limits. The research has shown that a tiny glass sphere—still over a thousand times smaller than a grain of sand but huge by quantum standards—can have its rotational motion cooled down to almost the quietest state allowed by quantum physics at about 92% purity, even while the particle itself is burning hot at several hundred degrees.

    This is the first time scientists have reached such a pure quantum state without having to chill the entire object to near absolute zero, opening doors to experiments once thought impossible outside of deep-freeze labs.

    “The purity reached by our room-temperature experiment exceeds the performance offered by mechanically clamped oscillators in a cryogenic environment, establishing a platform for high-purity quantum optomechanics at room temperature,” the study authors note.

    A clever shortcut targeting object’s specific motion

    Normally, to see quantum behavior in an object larger than a molecule, researchers have to go to extremes: levitating the particle in a vacuum to shield it from outside interference, and cooling its surroundings to near -273.15°C so its motion becomes as orderly as quantum rules allow. 

    Even then, it’s tricky. This is because motion in the quantum world is quantized—it can only happen in specific chunks called vibration quanta. There is a lowest-energy mode called the ground state, a first excited state with a little more energy, and so on. 

    Though the particle can exist in a mix of these states. Reaching the ground state for a large particle has been a milestone goal. Until now, it required cooling everything to frigid extremes.

    The study authors took a clever shortcut. Instead of trying to chill the particle’s entire internal energy (which is massive compared to the energy of its motion), they targeted just one specific motion: its rotation. 

    Controlling laser light, mirror systems to drain rotational energy

    The researchers used a nanoparticle shaped not as a perfect sphere, but as a slightly stretched ellipse. When trapped in an electromagnetic field, such a particle naturally rotates around a fixed alignment, like a compass needle wobbling around north. 

    By precisely controlling laser light and mirror systems, forming a high-finesse optical cavity, the team could influence this wobble. The trick here is that the laser can either feed energy into the rotation or take energy away from it.

    By carefully adjusting the mirrors so that energy removal was far more likely than energy addition, scientists drained almost all the rotational energy away. While doing so, they also had to account for and control quantum noise from the lasers, random fluctuations that could otherwise ruin the delicate process. 

    This resulted in a rotational motion freezing into a state extremely close to the quantum ground state, with just 0.04 quanta of residual energy and about 92% quantum purity, even though the particle’s internal temperature was still hundreds of degrees Celsius.

    The key to making quantum systems more practical 

    This result breaks a long-standing barrier in quantum research. It shows that one does not have to cool an entire object to ultra-low temperatures to study its quantum properties. 

    Instead, by treating different types of motion, like rotation, separately, one can selectively bring parts of a system into the quantum regime while the rest remains hot and messy. 

    This approach could make it much easier to explore quantum effects in bigger, more complex systems—from biological structures to engineered devices—without requiring massive cryogenic setups.

    However, the work focused on one specific motion in a carefully chosen nanoparticle. Hence, it is not yet an universal recipe for every large object. Future research will likely explore whether the same principles can control other motions or work with different shapes and materials. 

    The study has been published in the journal Nature Physics.

    Continue Reading