The April full moon will occur at 10:12 p.m. EDT on April 1 (0311 BST on April 2), as the lunar disk sits opposite the sun in Earth’s sky, fully lit by its rays.
April’s full moon is often called the “Pink Moon“, in reference to the…

The April full moon will occur at 10:12 p.m. EDT on April 1 (0311 BST on April 2), as the lunar disk sits opposite the sun in Earth’s sky, fully lit by its rays.
April’s full moon is often called the “Pink Moon“, in reference to the…
OXFORD, Miss. – A new University of Mississippi study shows that some sound waves don’t just move forward – they also move slightly to the side. Understanding this movement could help researchers develop more precise acoustic tools.
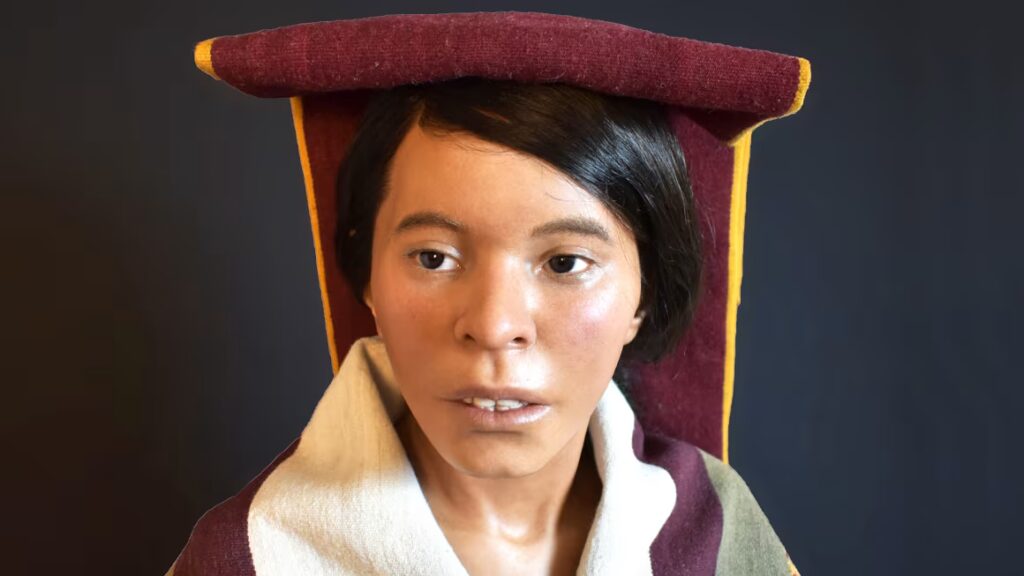
When you slide a 500-year-old frozen child into a…

Students in New York will hear from NASA astronauts Jack Hathaway and Chris Williams as they answer prerecorded science, technology, engineering, and mathematics (STEM) questions while aboard the International Space Station.
The Earth-to-space…
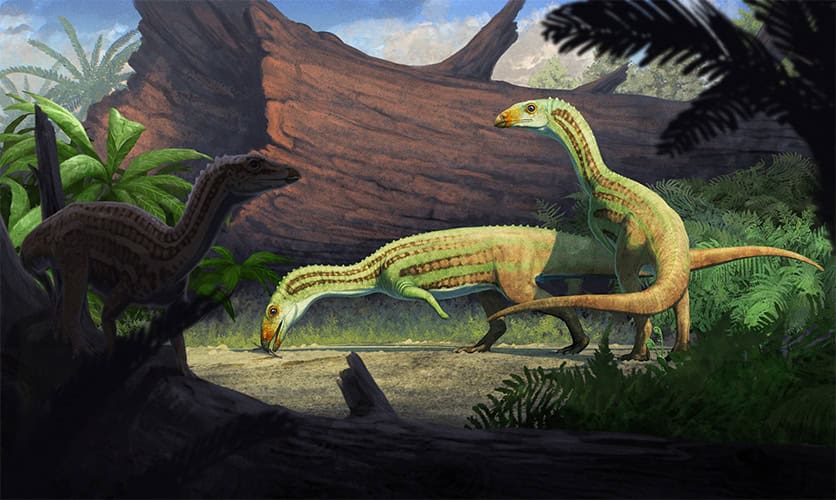
When you picture an ancient crocodile from millions of years ago, you…
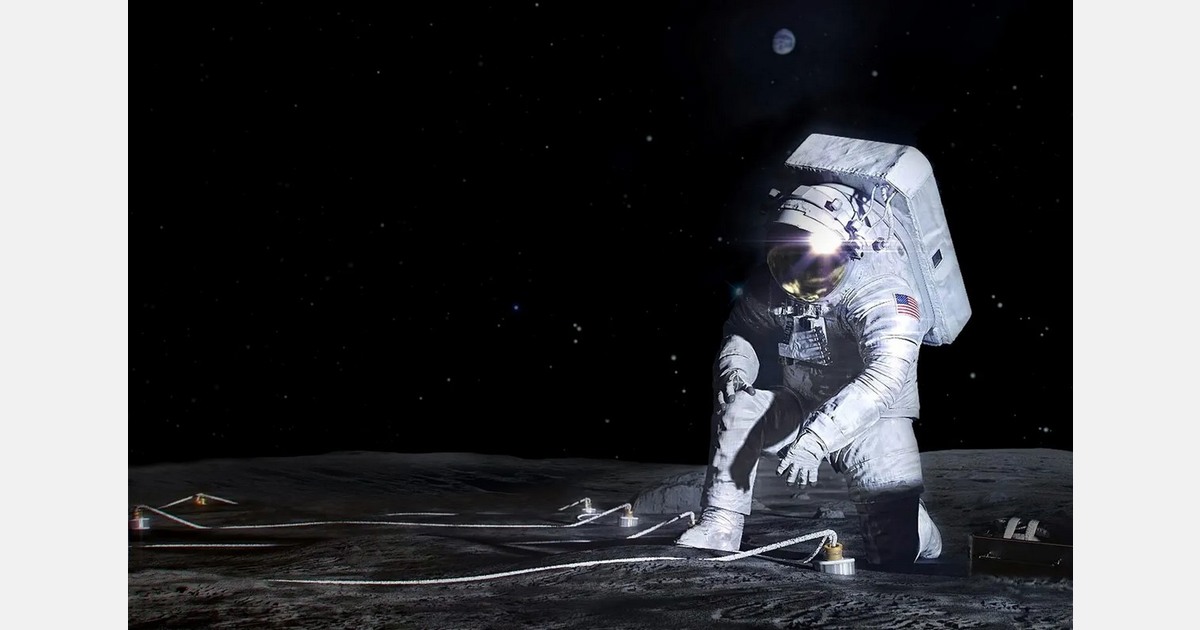
If the idea of lunar hummus seems far-fetched, think again. Scientists working to cultivate the field of extraterrestrial…
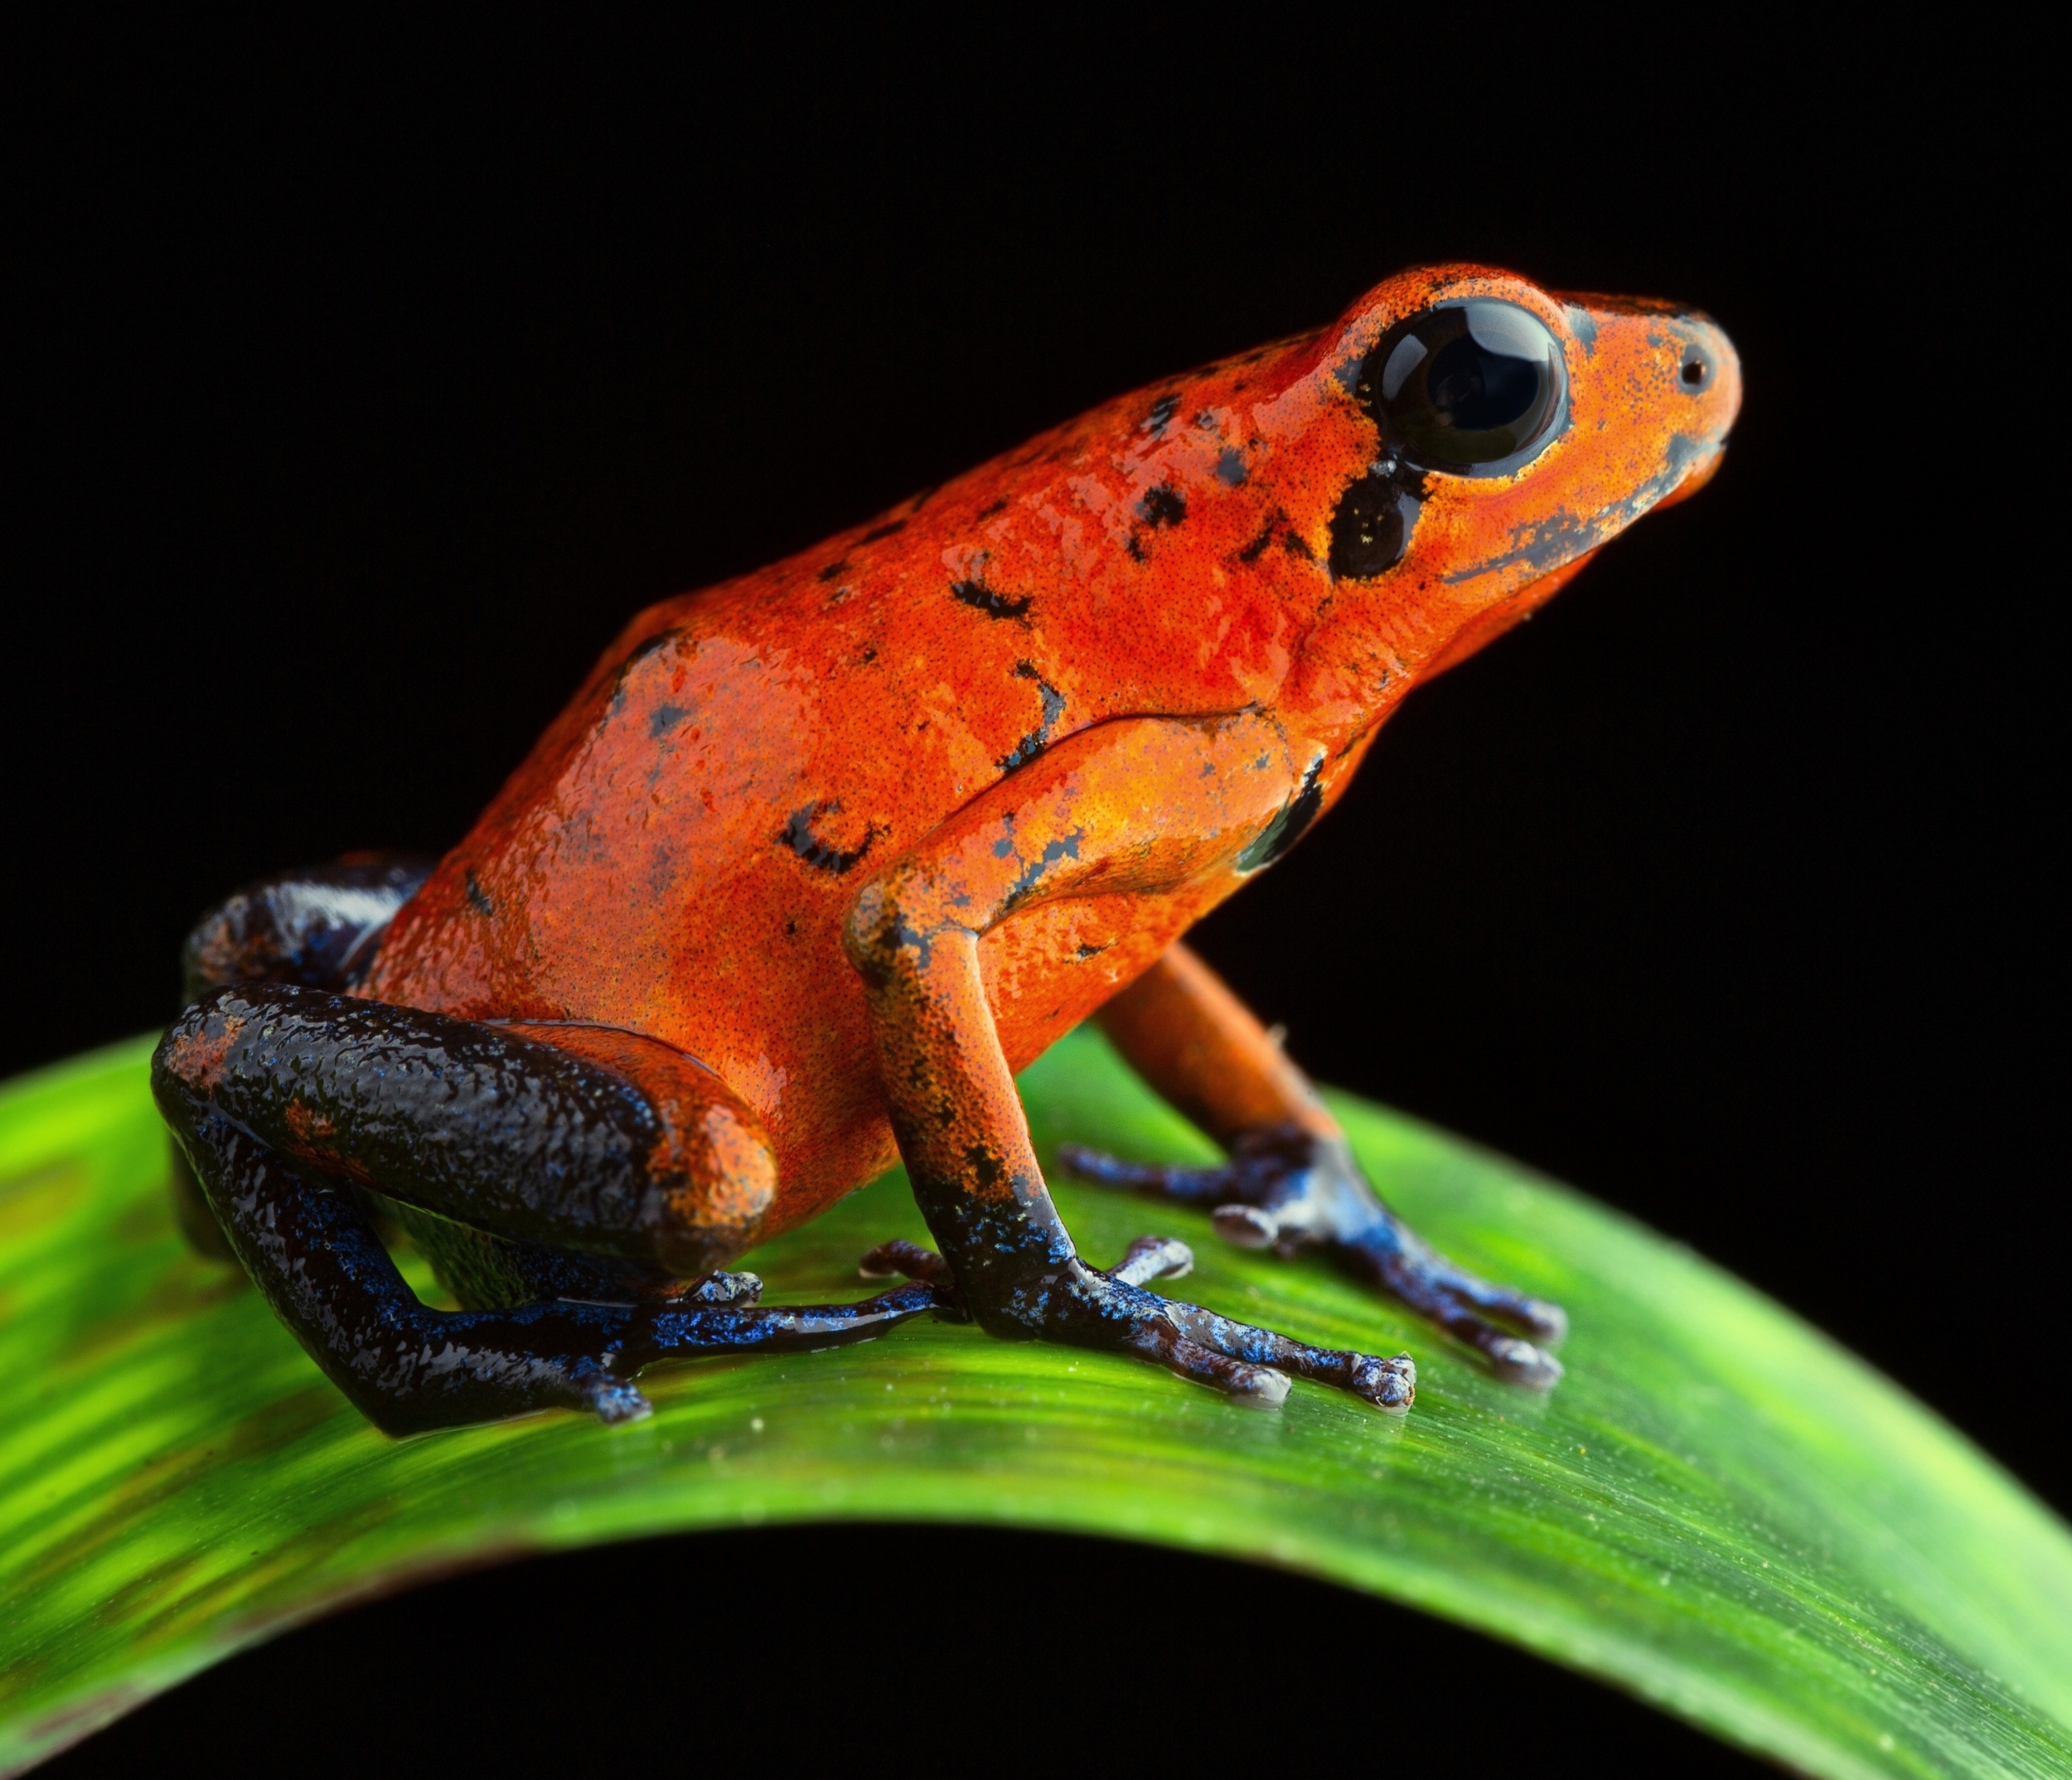
A tiny sting from a wasp can cause sharp pain. The skin of some frogs can irritate predators in seconds. Scientists now understand that both animals use a powerful chemical toxin that looks surprisingly similar to a molecule found in humans and…

An effective way to maximize the likelihood of success while significantly reducing the number of required trial enrollees is to pre-stratify potential participants, ensuring that those most likely to respond to the drug are included in the…