Qaasid News
Download Our App
Latest News from Pakistan
Kashmir Solidarity Day: Pakistani leadership reaffirms support for Kashmiris’ just struggle – Dawn
February 5, 2026
February 4, 2026 — Brody King Earns AEW World Title Shot, Andrade vs. Hangman at AEW Grand Slam Australia, More
February 5, 2026
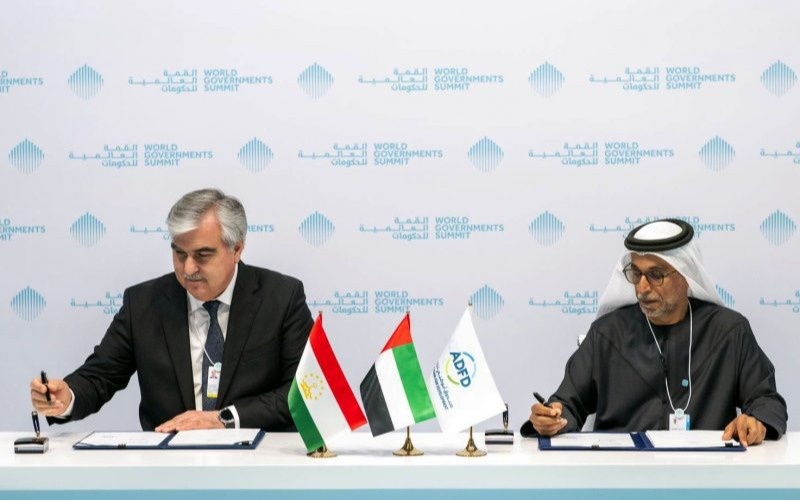
Tajikistan focuses on energy security, signs landmark deal
February 5, 2026
Iran-US nuclear talks to be held in Oman tomorrow – RADIO PAKISTAN
February 5, 2026
Canon’s Wild New RF 7-14mm f/2.8-3.5L Fisheye Is First of its Kind With 190° FOV
February 5, 2026
Canon is releasing a limited edition version of the viral PowerShot G7 X Mark III.
February 5, 2026
Gut microbial butyrate enhances mucosal vaccine antibody responses
February 5, 2026
Uzbek President arrives in Pakistan today on 2-day visit – RADIO PAKISTAN
February 5, 2026
New crew set to launch for International Space Station after medical evacuation
February 5, 2026
Edwards Scores 30 Points As Timberwolves Rally for 5th Win in Six Games, Beat Raptors 128-126. – NBA
February 5, 2026