Qaasid News
Download Our App
Latest News from Pakistan
‘Grave moment’: end of US-Russia nuclear pact comes at worst possible time, UN chief warns | Nuclear weapons
February 5, 2026
Dove Cameron says timing mattered when she first met Damiano David
February 5, 2026
Construction of Fukui Murata Manufacturing’s New Ceramic Capacitor R&D Center Completed
February 5, 2026
Feeding nostalgia – Dawn
February 5, 2026
Feeding nostalgia – Dawn
February 5, 2026
Monopolising truth – Dawn
February 5, 2026
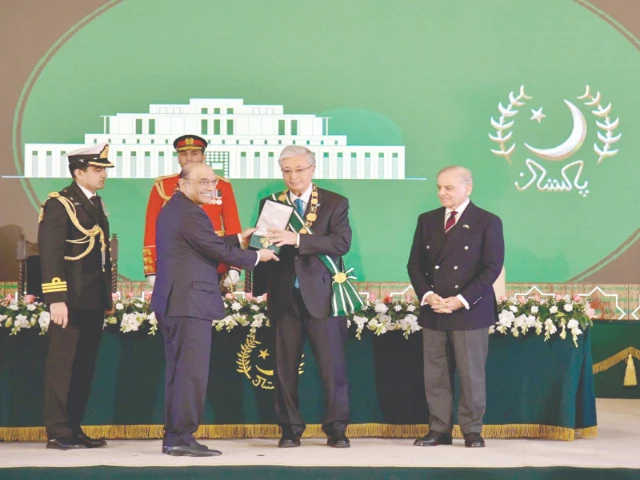
Pakistan, Kazakhstan upgrade relations to strategic level
February 5, 2026
India’s oil imports from Russia down amid trade talks with US – Dawn
February 5, 2026
UN experts slam Israel’s ‘terrorist’ death penalty bill – Dawn
February 5, 2026
New arms race looms as last US-Russia treaty set to expire – Dawn
February 5, 2026