Qaasid News
Download Our App
Latest News from Pakistan
February 7, 2026 – Ciampa Defends TNT Title in 3-Way, 8-Man Parking Lot Fight, More
February 7, 2026
Minibus crash kills 12 in northeastern Afghanistan – Arab News
February 7, 2026
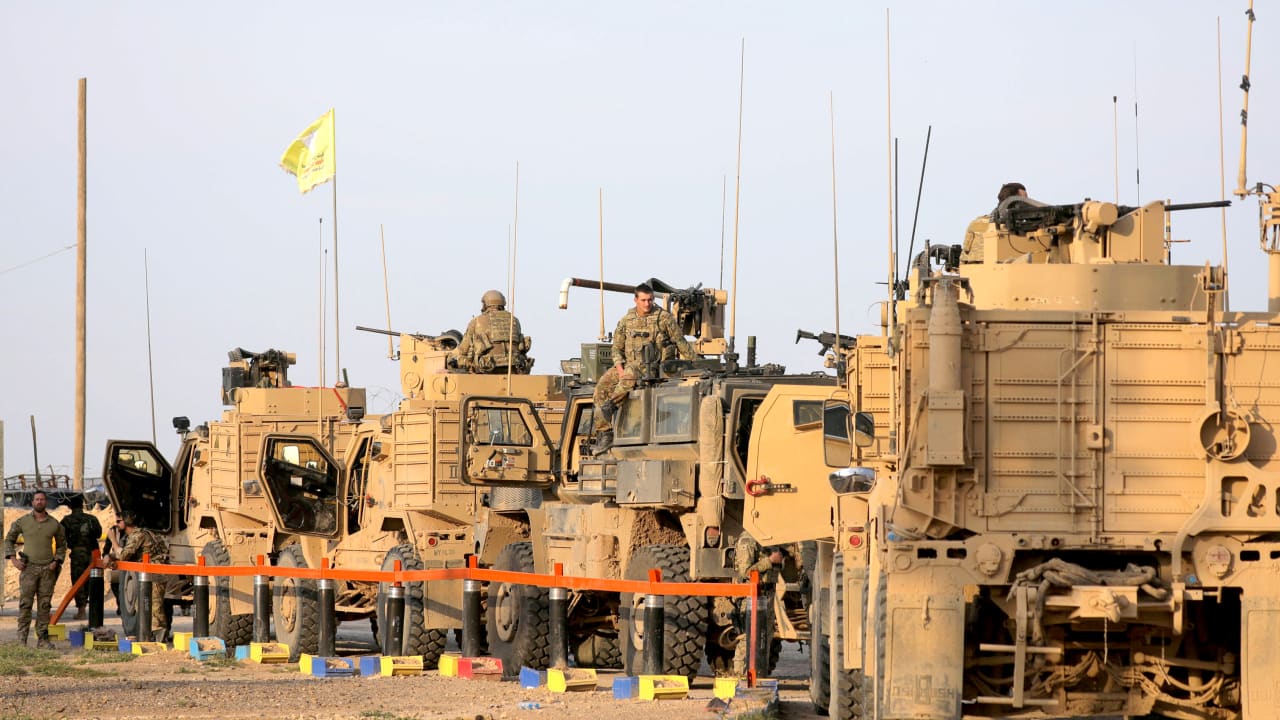
Araghchi: Iran will strike US bases in Mideast if attacked
February 7, 2026
TikTok’s favourite headphones are 20% off
February 7, 2026
Saturday Citations: Imaginative bonobos; cannabis brain benefits; sneaky beetles – Phys.org
February 7, 2026
Five stocks with more upside based on their latest earnings
February 7, 2026
ESA releases high resolution bird eye view of Flaugergues Crater on Mars |
February 7, 2026
The women who saw Melania in theaters: ‘If you’re Republican, this is girls’ night’ | US news
February 7, 2026
Survey suggests link between chatbot dependency and depression – Medical Xpress
February 7, 2026
What's next for the U.S. and Iran following preliminary talks? – NPR
February 7, 2026