Qaasid News
Download Our App
Latest News from Pakistan
PUIC calls for end to occupation of Palestinian territories-Xinhua
February 4, 2026
Goodbye, breast implants: why I went back to having a flat chest | Well actually
February 4, 2026
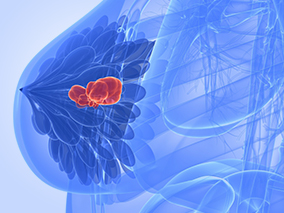
Addition of Palbociclib to Standard Therapy in Hormone Receptor–Positive, HER2-Positive Metastatic Breast Cancer
February 4, 2026
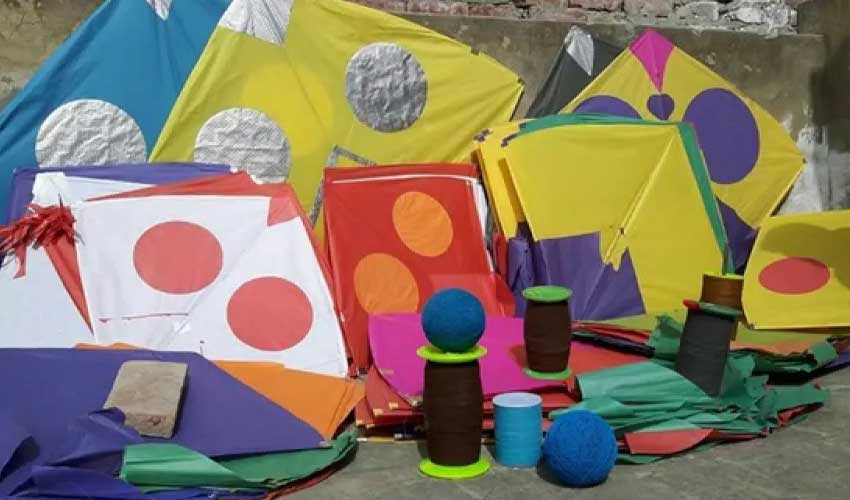
CM Maryam takes notice of rise in kite-flying equipment prices in Lahore
February 4, 2026
Can India switch from Russian to Venezuelan oil, as Trump wants? | Energy News
February 4, 2026
‘Downright adorable’: why Alan Carr and Amanda Holden are TV’s most lovable duo | Television
February 4, 2026
Libya’s former leader Gaddafi’s son Saif killed by ‘four-man commando’, confirms lawyer
February 4, 2026
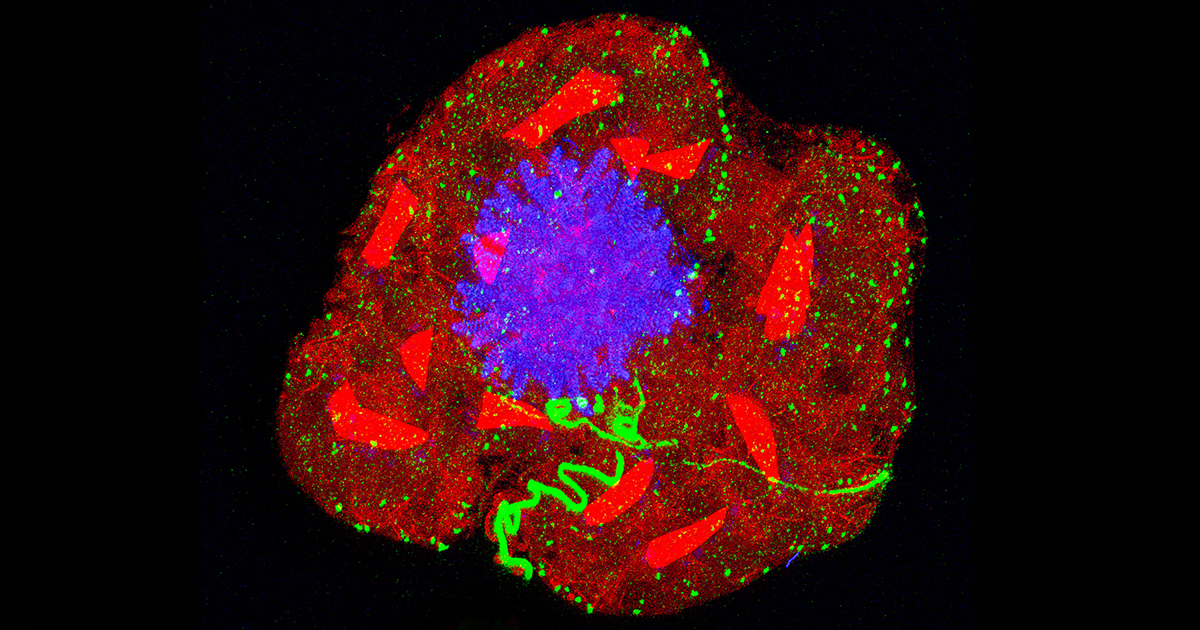
Expansion Microscopy Has Transformed How We See the Cellular World
February 4, 2026
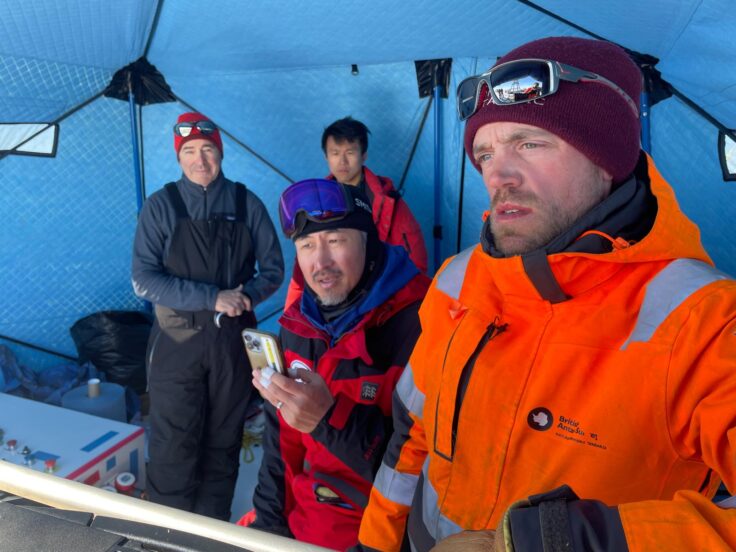
Thwaites Glacier Study Faces Unexpected Challenges
February 4, 2026
NBA Fantasy: DFS picks & advice for Feb. 4 – NBA
February 4, 2026