Qaasid News
Download Our App
Latest News from Pakistan
Winter Olympics 2026 – Great Britain’s curling legacy: From Edinburgh rinks to Olympic medals
February 7, 2026
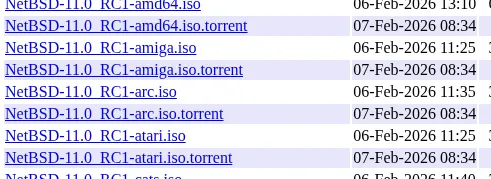
NetBSD 11.0-RC1 Available For Testing With Enhanced Linux Emulation
February 7, 2026
This Week In Space podcast: Episode 196 — Becoming Martian!
February 7, 2026
Assessing Jefferies Financial Group (JEF) After Recent Share Pullback And Sector Sentiment Shift
February 7, 2026
Bad Bunny’s Big Week Has Been Full of Spectacular Watches
February 7, 2026
Wall Street’s wild week rattles investors’ confidence while highlighting a growing divide within markets
February 7, 2026
In this Icelandic drama, a couple quietly drifts apart
February 7, 2026
Anthems, agency and arias: baritone Davóne Tines on rewriting his role – and the rules | Classical music
February 7, 2026
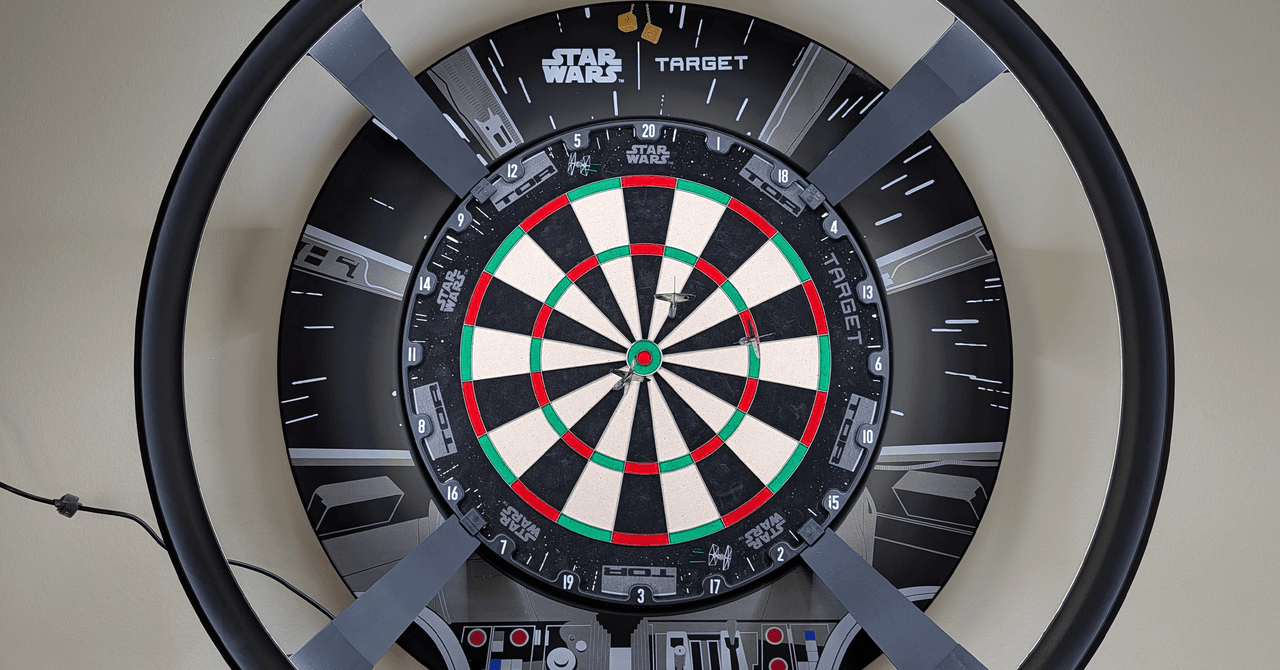
Target Darts Omni Auto Scoring System Hits the Mark
February 7, 2026
February 7, 2026 – Ciampa Defends TNT Title in 3-Way, 8-Man Parking Lot Fight, More
February 7, 2026