Qaasid News
Download Our App
Latest News from Pakistan
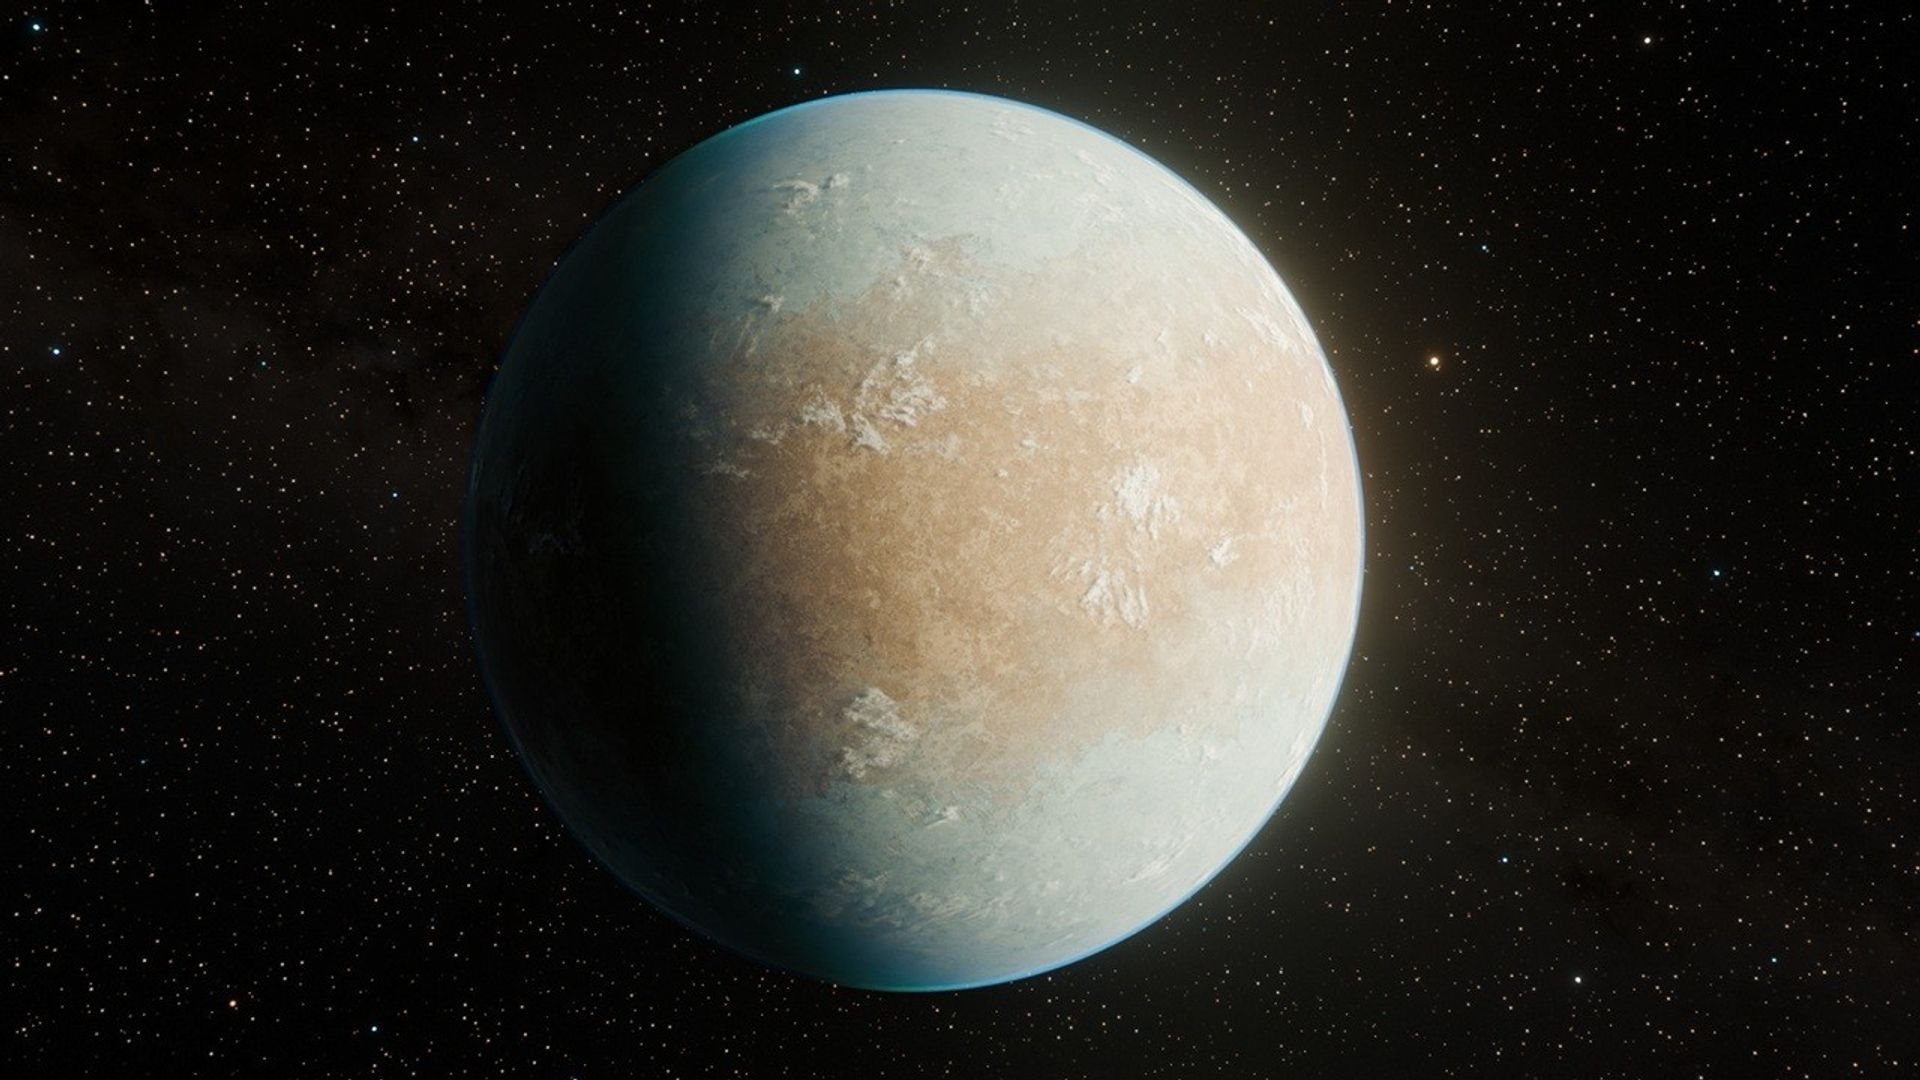
A ‘cold Earth’ exoplanet just 146 light-years away might be in its star’s habitable zone — if it exists
February 4, 2026
Snap elections lock Japan in a cycle of fragile promises
February 4, 2026
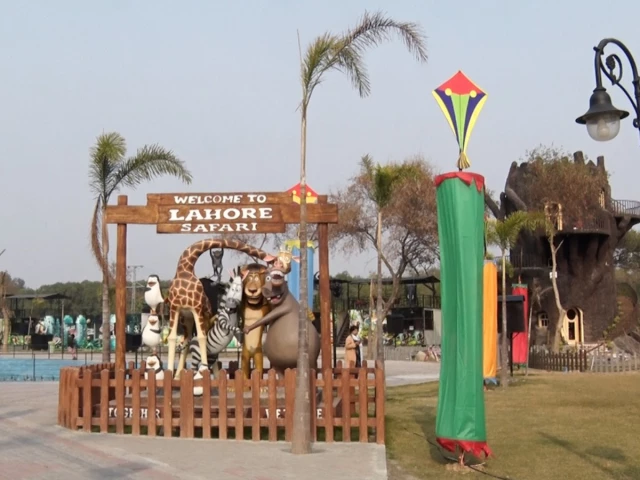
Lahore Safari Zoo decorated for three-day Basant festival
February 4, 2026
What are Iran's ballistic missile capabilities? – Reuters
February 4, 2026
Major disruption on south-east England rail lines after ‘multiple incidents’
February 4, 2026
Xi, Putin hail ties in video call as Ukraine war nears anniversary – Reuters
February 4, 2026
Surgeons Kept a Man With No Lungs Alive For 48 Hours While Waiting For a Transplant
February 4, 2026
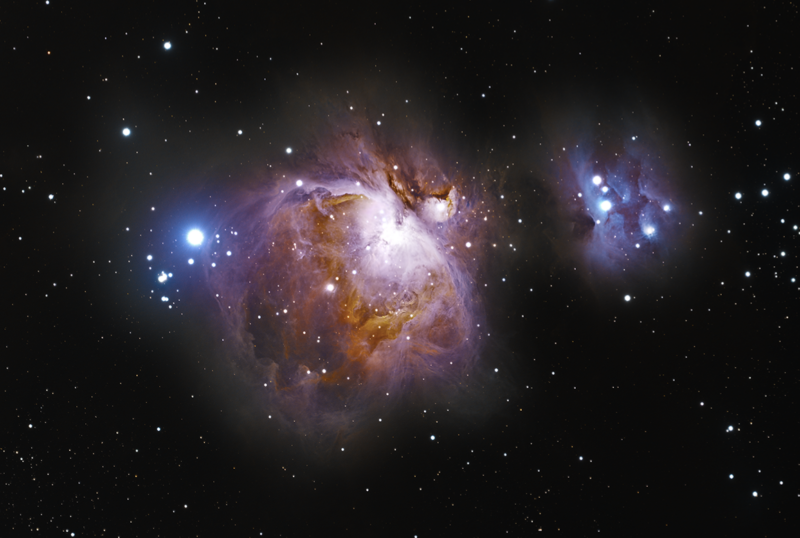
See the best deep-sky photos of January 2026 here
February 4, 2026
Israeli strikes kill 18 in Gaza and patient crossings at Rafah halted, Palestinian officials say | Gaza
February 4, 2026
PUBG: BATTLEGROUNDS LAUNCHES UPDATE 40.1 FEATURING SPRING FEST 2026 AND ERANGEL UPDATES
February 4, 2026