Qaasid News
Download Our App
Latest News from Pakistan
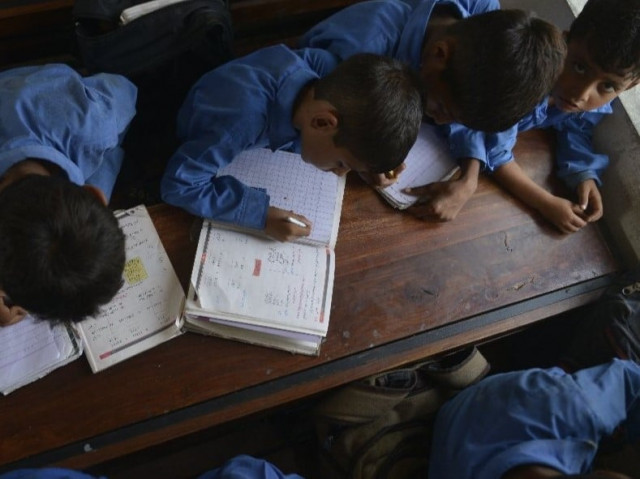
Pakistan ranks lowest in South Asia on literacy despite slow gains, FAFEN says
February 2, 2026
Winter inactivity can harm physical and mental health
February 2, 2026
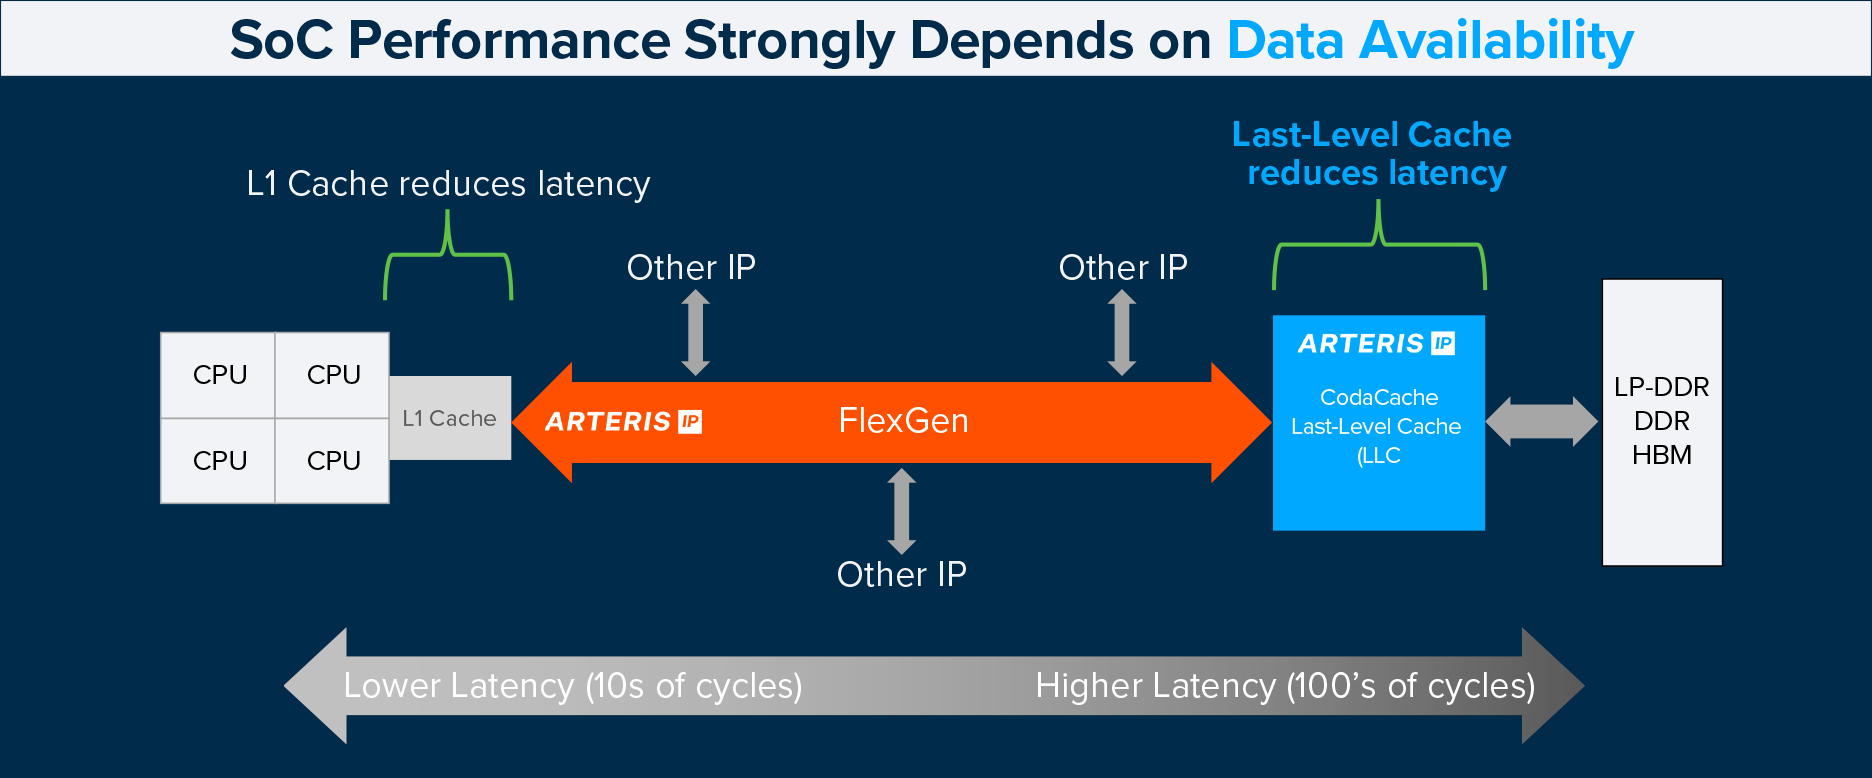
Solving Real-World AI Bottlenecks
February 2, 2026
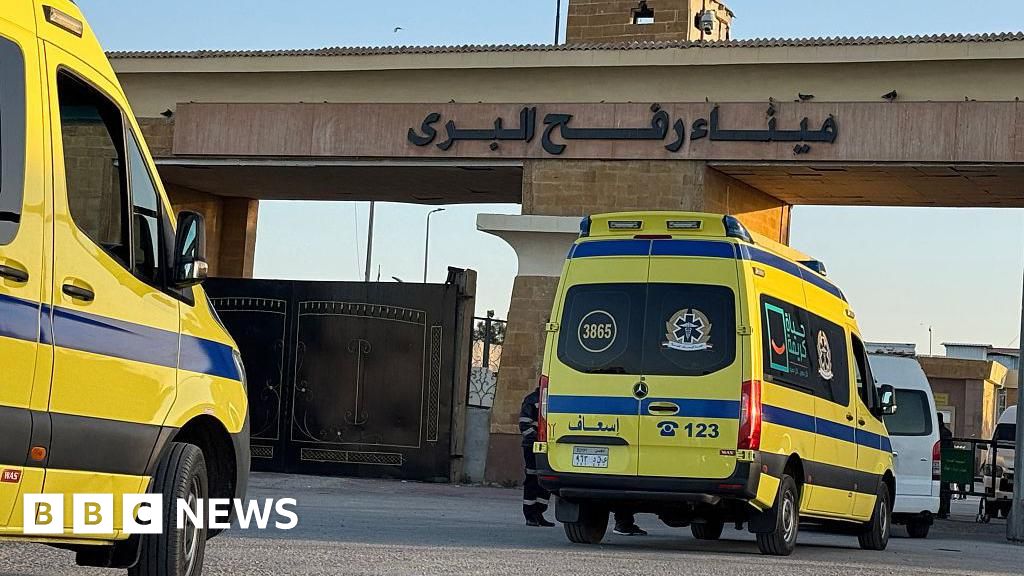
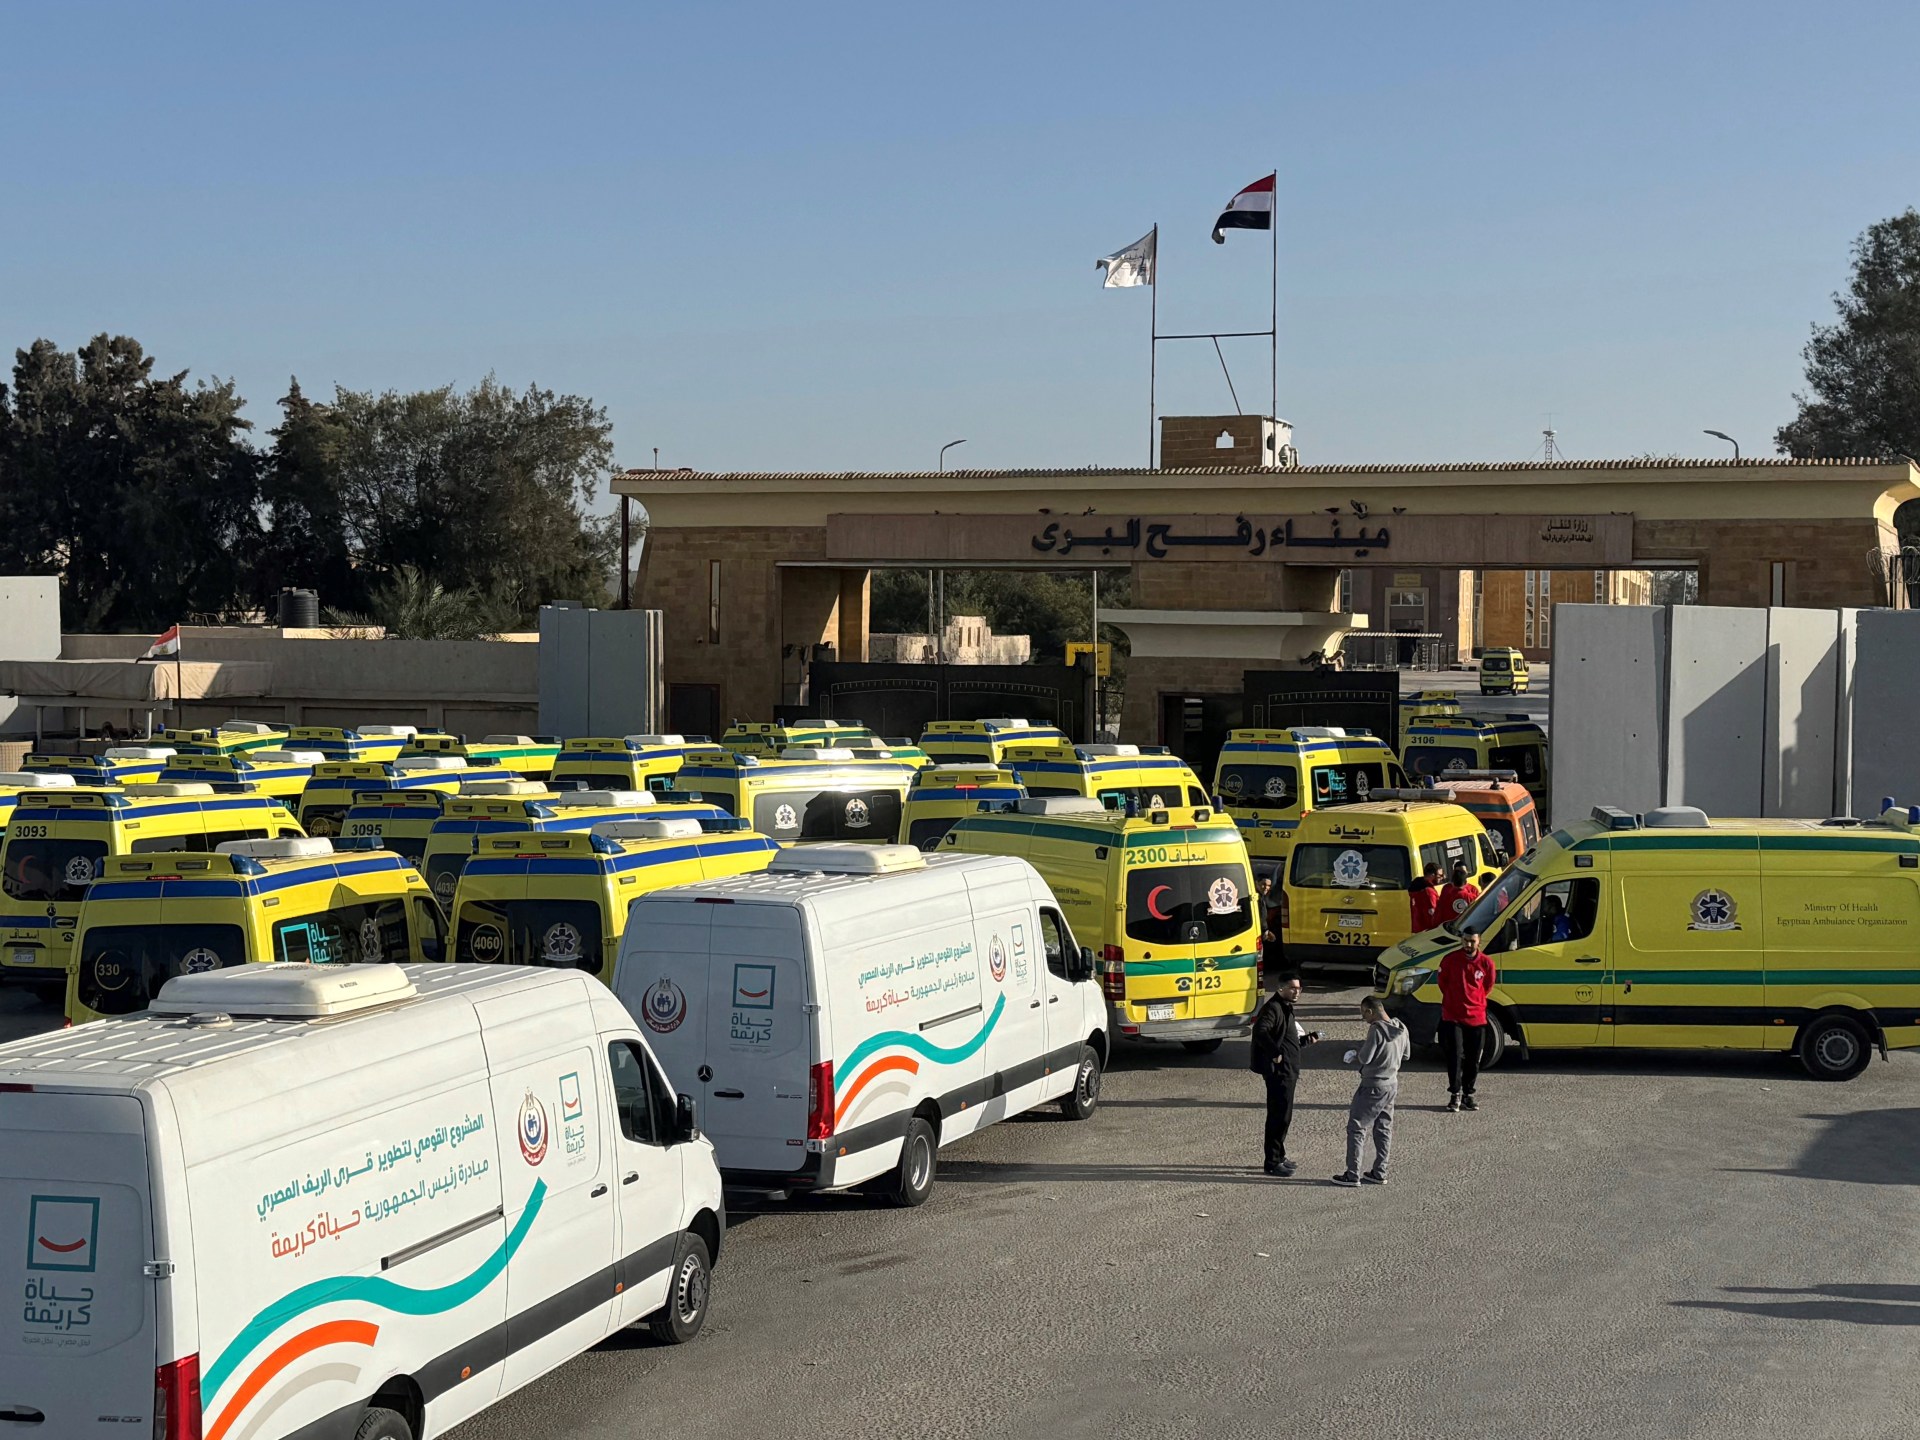
Israel reopens Gaza’s Rafah border crossing to Egypt, with limits – Dawn
February 2, 2026
Israel reopens Gaza’s Rafah border crossing to Egypt, with limits – Dawn
February 2, 2026
Gaza's key Rafah border crossing with Egypt reopens – BBC
February 2, 2026
Emerging market stocks rally appears intact after buoyant January inflows – Reuters
February 2, 2026
3I/ATLAS: Harvard Astrophysicist Avi Loeb Flags Puzzling Methane Outgassing In New Hubble & Webb Data
February 2, 2026
Gaza’s Rafah crossing reopens for limited traffic | News
February 2, 2026
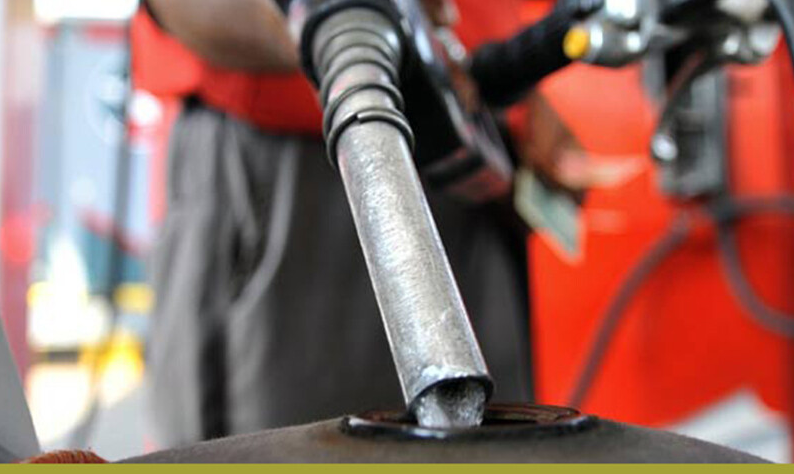
Petroleum firm begins payments in PKR 47bn recovery case
February 2, 2026