Qaasid News
Download Our App
Latest News from Pakistan
Sarah Ferguson distressed as ‘no daughter has offered accomodation’ amid exile
February 1, 2026
Royal Rumble 2026 big takeaways: What’s next for Roman Reigns, AJ Styles, Liv Morgan and more
February 1, 2026
Why Trump’s new pick for Fed chair hit gold and silver markets – for good reasons
February 1, 2026
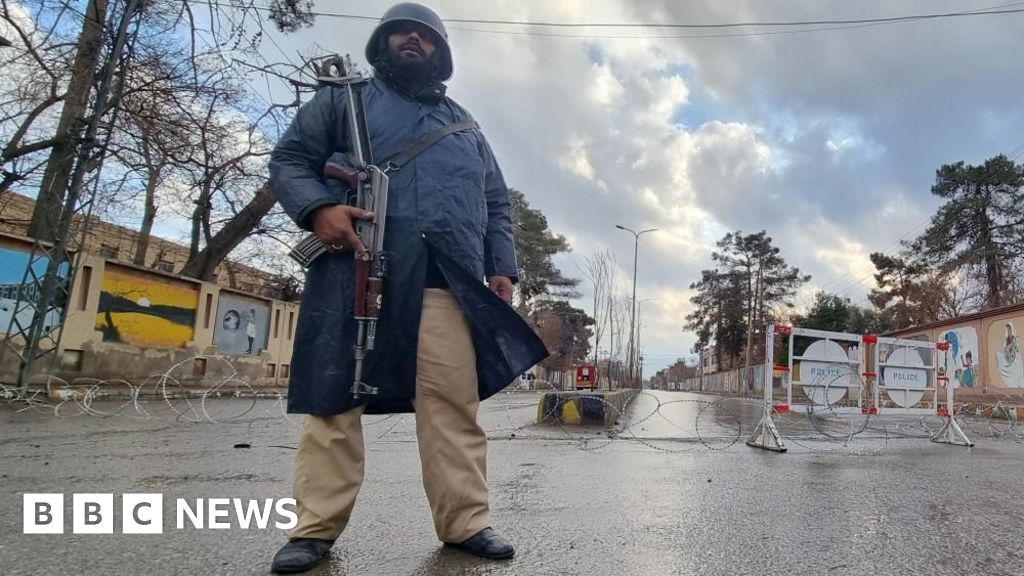
Pakistan military says it has killed 92 militants in Balochistan – BBC
February 1, 2026
Iran signals headway in US negotiations, issues warning against strikes
February 1, 2026
Liverpool 4-1 Newcastle: Hugo Ekitike draws Fernando Torres comparison as he haunts former admirers Newcastle
February 1, 2026
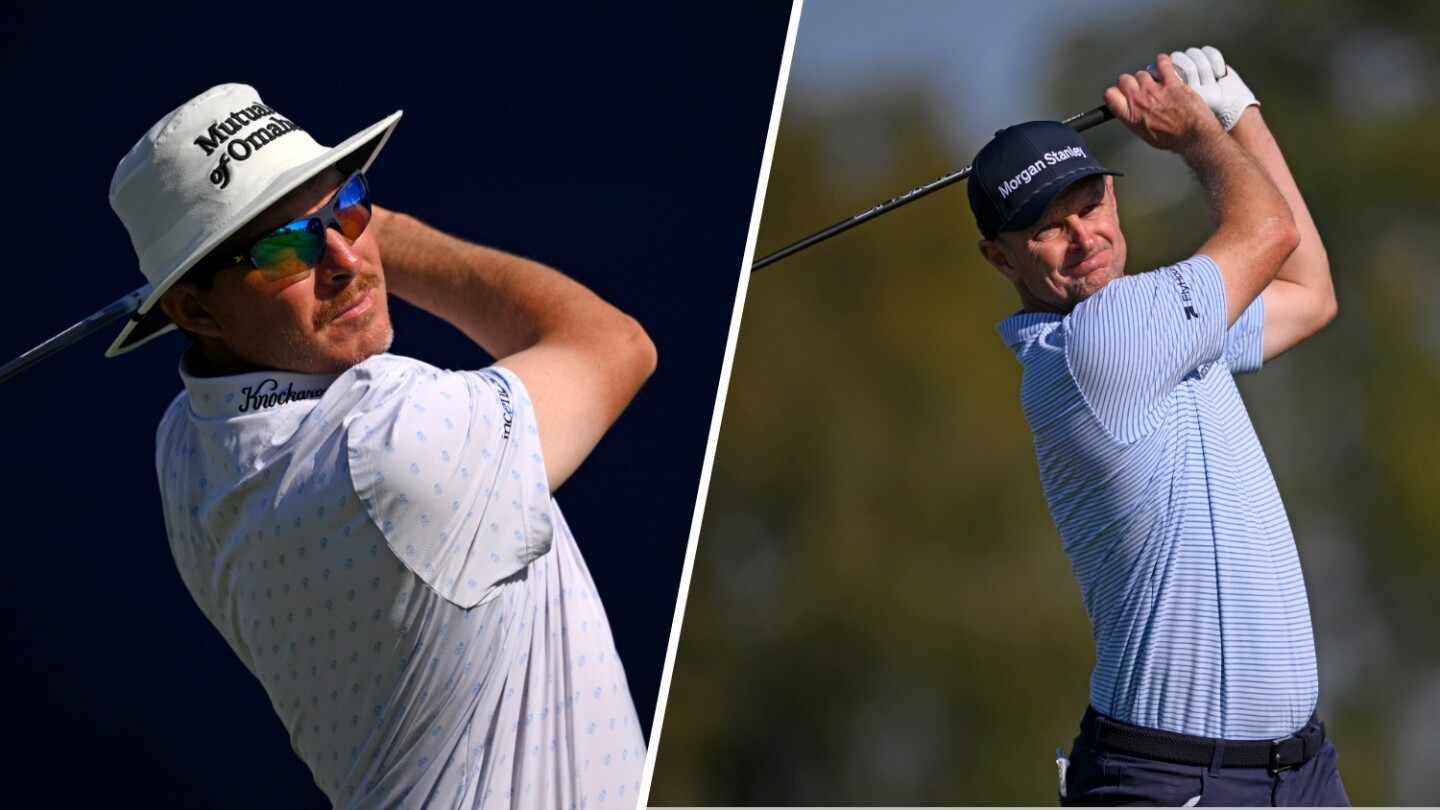
Farmers Insurance Open 2026: Final round tee times, groupings, how to watch
February 1, 2026
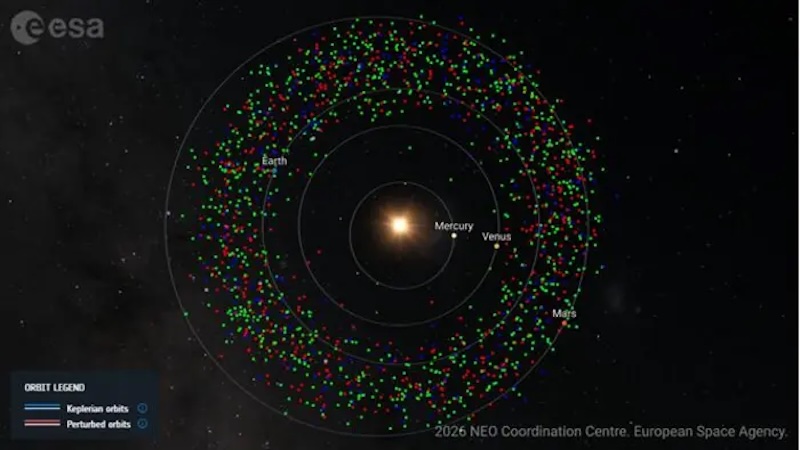
Taxonomic Classification Of 80 Near-Earth Asteroids Reveals Key Insights Into Their Origins, Evolution And Planetary Defense Significance
January 31, 2026
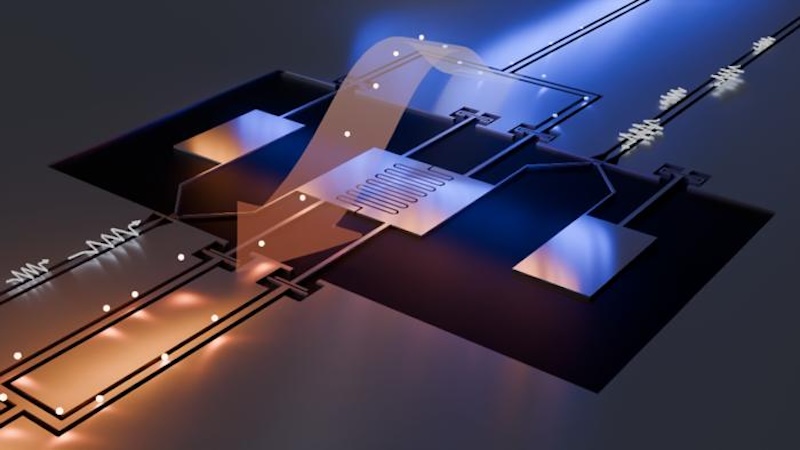
Novel Quantum Refrigerator Benefits From Problematic Noise – Eurasia Review
January 31, 2026
Wembanyama in action in a 6 game-Saturday
January 31, 2026