Qaasid News
Download Our App
Latest News from Pakistan
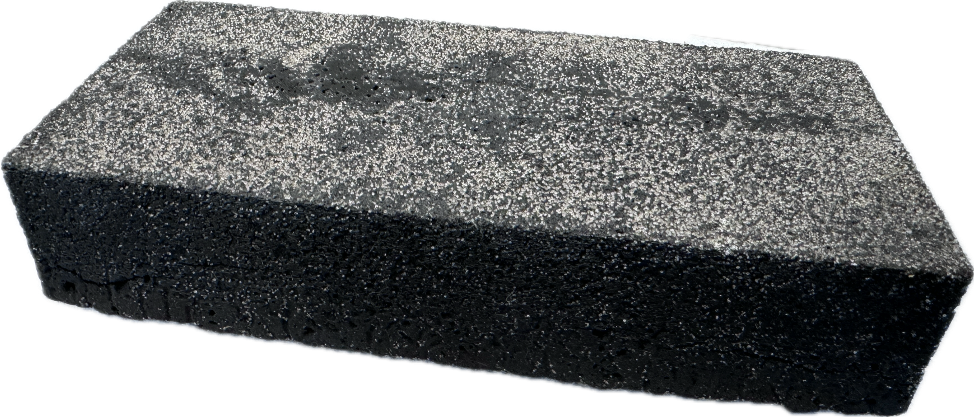
A water-durable construction material that also sequesters CO2 – Chemical Engineering
February 1, 2026
Today’s Hurdle hints and answers for February 1, 2026
February 1, 2026
3 things to know about NBC’s Sunday Night Basketball
February 1, 2026
NASA scientists help identify what powers this type of aurora
February 1, 2026
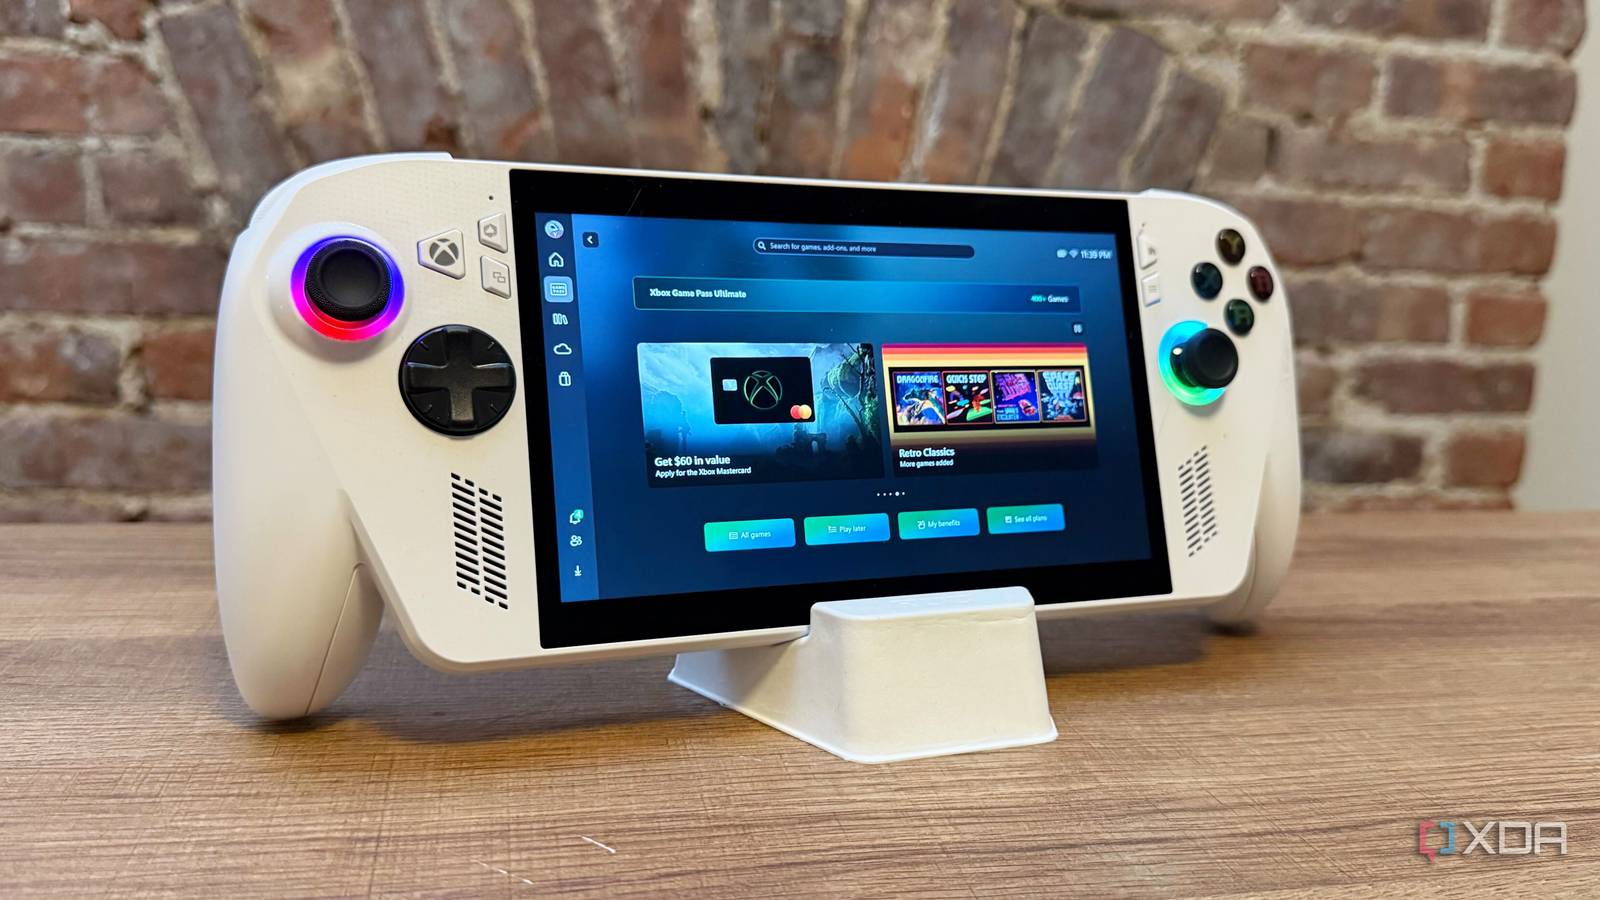
The Asus ROG Xbox Ally isn’t even four months old, and it’s already $110 off
February 1, 2026
January 31, 2026 – Ciampa Wins TNT Championship, Kidd Attacks Allin, Women’s Champions Laid Out, More
February 1, 2026
Iranian president says war neither in interest of Iran nor US – Al Arabiya English
February 1, 2026
Is It Time To Reconsider Air France-KLM (ENXTPA:AF) After Its Recent Share Price Swings?
February 1, 2026
Microsoft confirms that a stack of bad Windows updates is causing boot issues
February 1, 2026
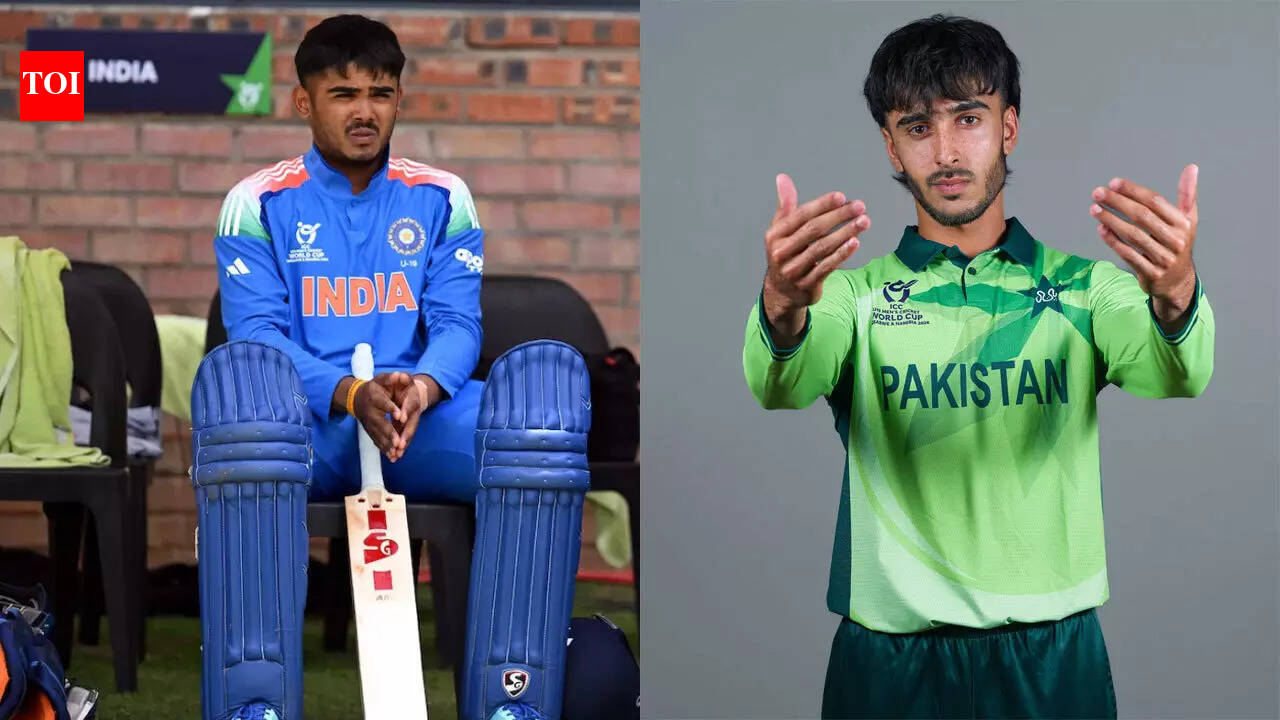
India vs Pakistan showdown: ICC reveals make-or-break scenario for U19 World Cup semi-final | Cricket News
February 1, 2026