Qaasid News
Download Our App
Latest News from Pakistan
Federal govt launches Chromebook distribution project in KP – RADIO PAKISTAN
December 21, 2025
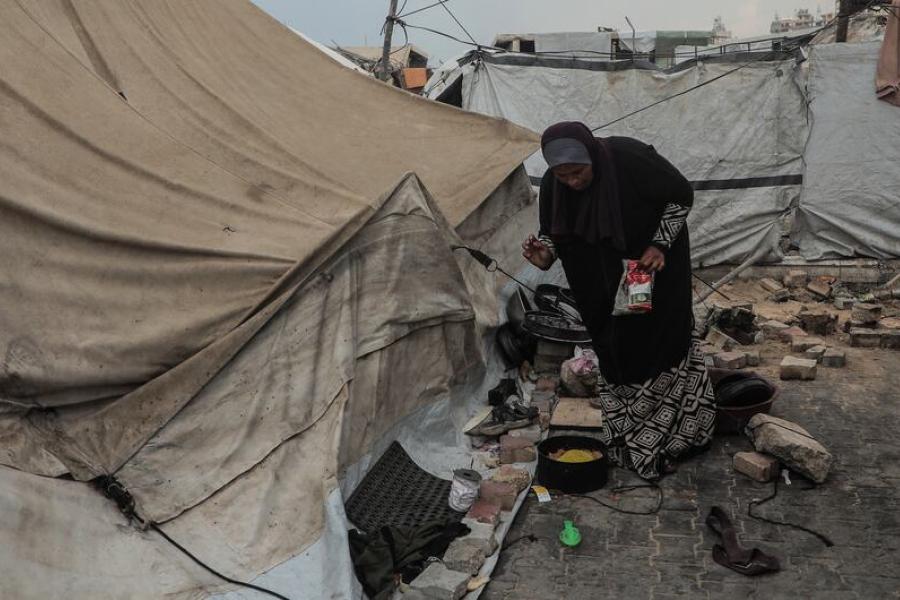
Gaza famine pushed back, but millions still face hunger and malnutrition, UN says
December 21, 2025
The Ashes: England beaten by Australia in Adelaide to lose another series down under
December 21, 2025
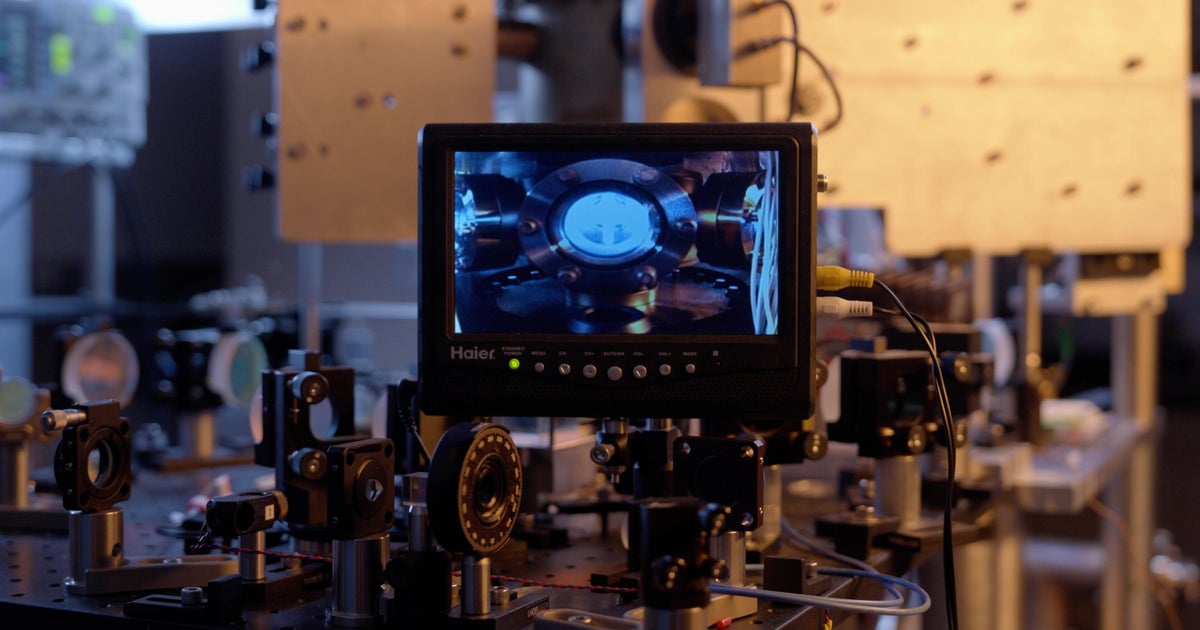
Power outage in Boulder area affects atomic clock, “Time is not broken” NIST says
December 21, 2025
How a Reddit tip proved vital for uncovering the suspect of the Brown University shooting
December 21, 2025
US firm delivers three 12-kilowatt thrusters for NASA’s lunar gateway
December 21, 2025
Five Wildcats Score in Double Figures in 106-76 win over South Dakota
December 21, 2025
Pakistan installs border scanners to speed up trade with China, Iran – RADIO PAKISTAN
December 21, 2025
Rutgers 70-69 Pennsylvania (Dec 20, 2025) Game Recap – ESPN
December 21, 2025
Chinese researchers achieve progress in clinical trial of brain-computer interface-Xinhua
December 21, 2025