Qaasid News
Download Our App
Latest News from Pakistan
What agreements have been made during Starmer’s trip to China? | Trade policy
January 29, 2026
Today’s top news: Occupied Palestinian Territory
January 29, 2026
Pakistan, Egypt strengthen ties with focus on health sector cooperation – Daily Times
January 29, 2026
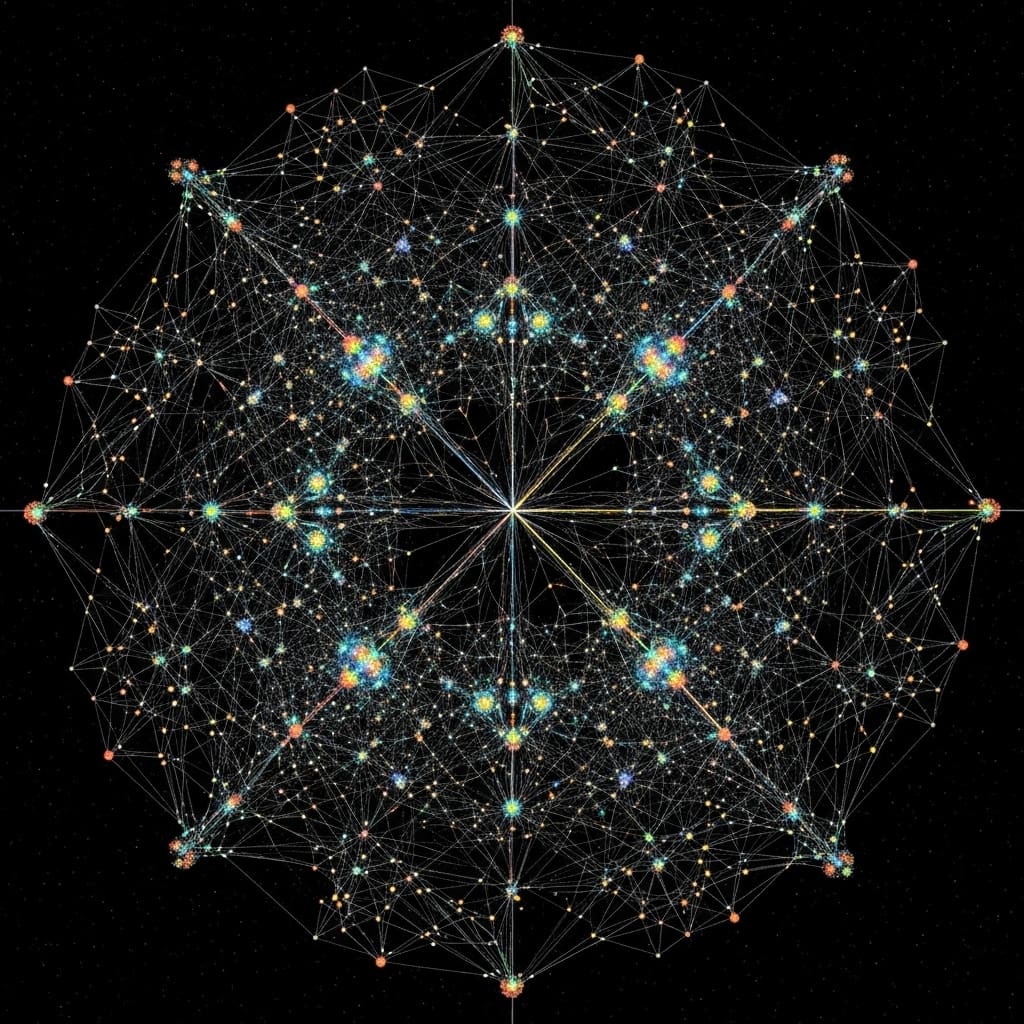
Symmetric Quantum States Achieved Via Complete Graphs And Odd 3-Qudit Systems
January 29, 2026
Jake Moon returns to EastEnders in February for special storyline full of “real twists and turns”
January 29, 2026
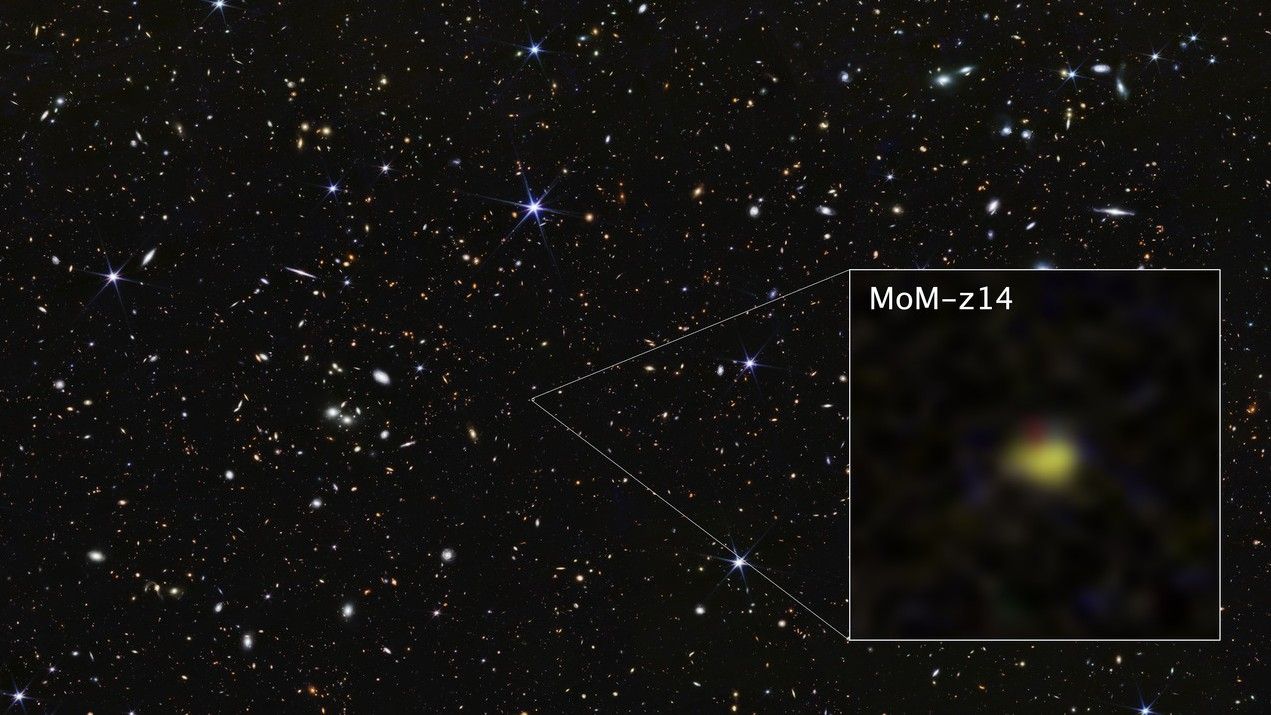
‘Previously unimaginable’: James Webb telescope breaks its own record again, discovering farthest known galaxy in the universe
January 29, 2026
“You are like the special secret source of magic at the Games”
January 29, 2026
Insights from Brain’s Waste-Flushing System May Improve Diagnosis of Idiopathic Intracranial Hypertension
January 29, 2026
Hellmann's Hits a High Note with "Sweet Sandwich Time" in Big Game Ad – VML
January 29, 2026
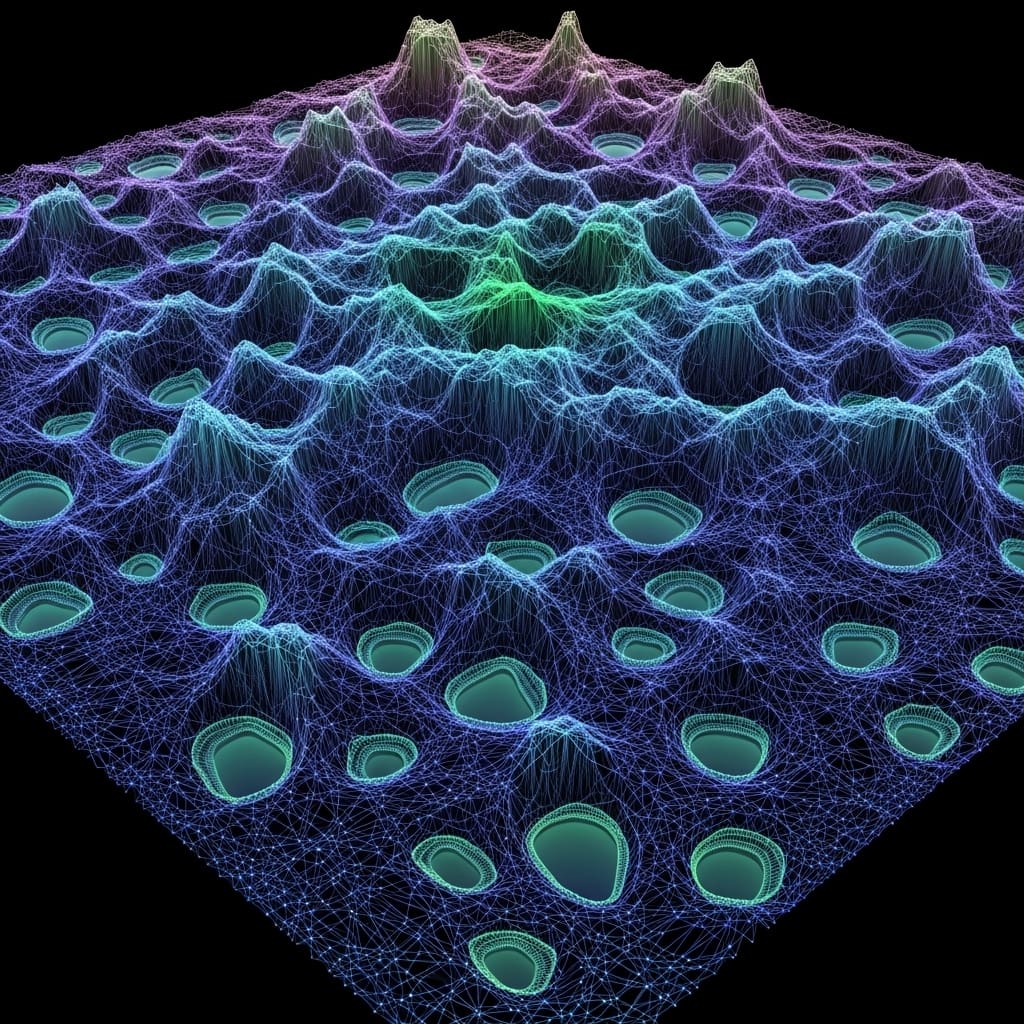
Critical Organisation Of Deep Neural Networks Achieves Infinite States Beyond One Parameter
January 29, 2026