Qaasid News
Download Our App
Latest News from Pakistan
Choose peace over chaos, Guterres urges as he sets out final-year priorities – UN News
January 29, 2026
Champions League Team of the Week: Matchday 8 – UEFA.com
January 29, 2026
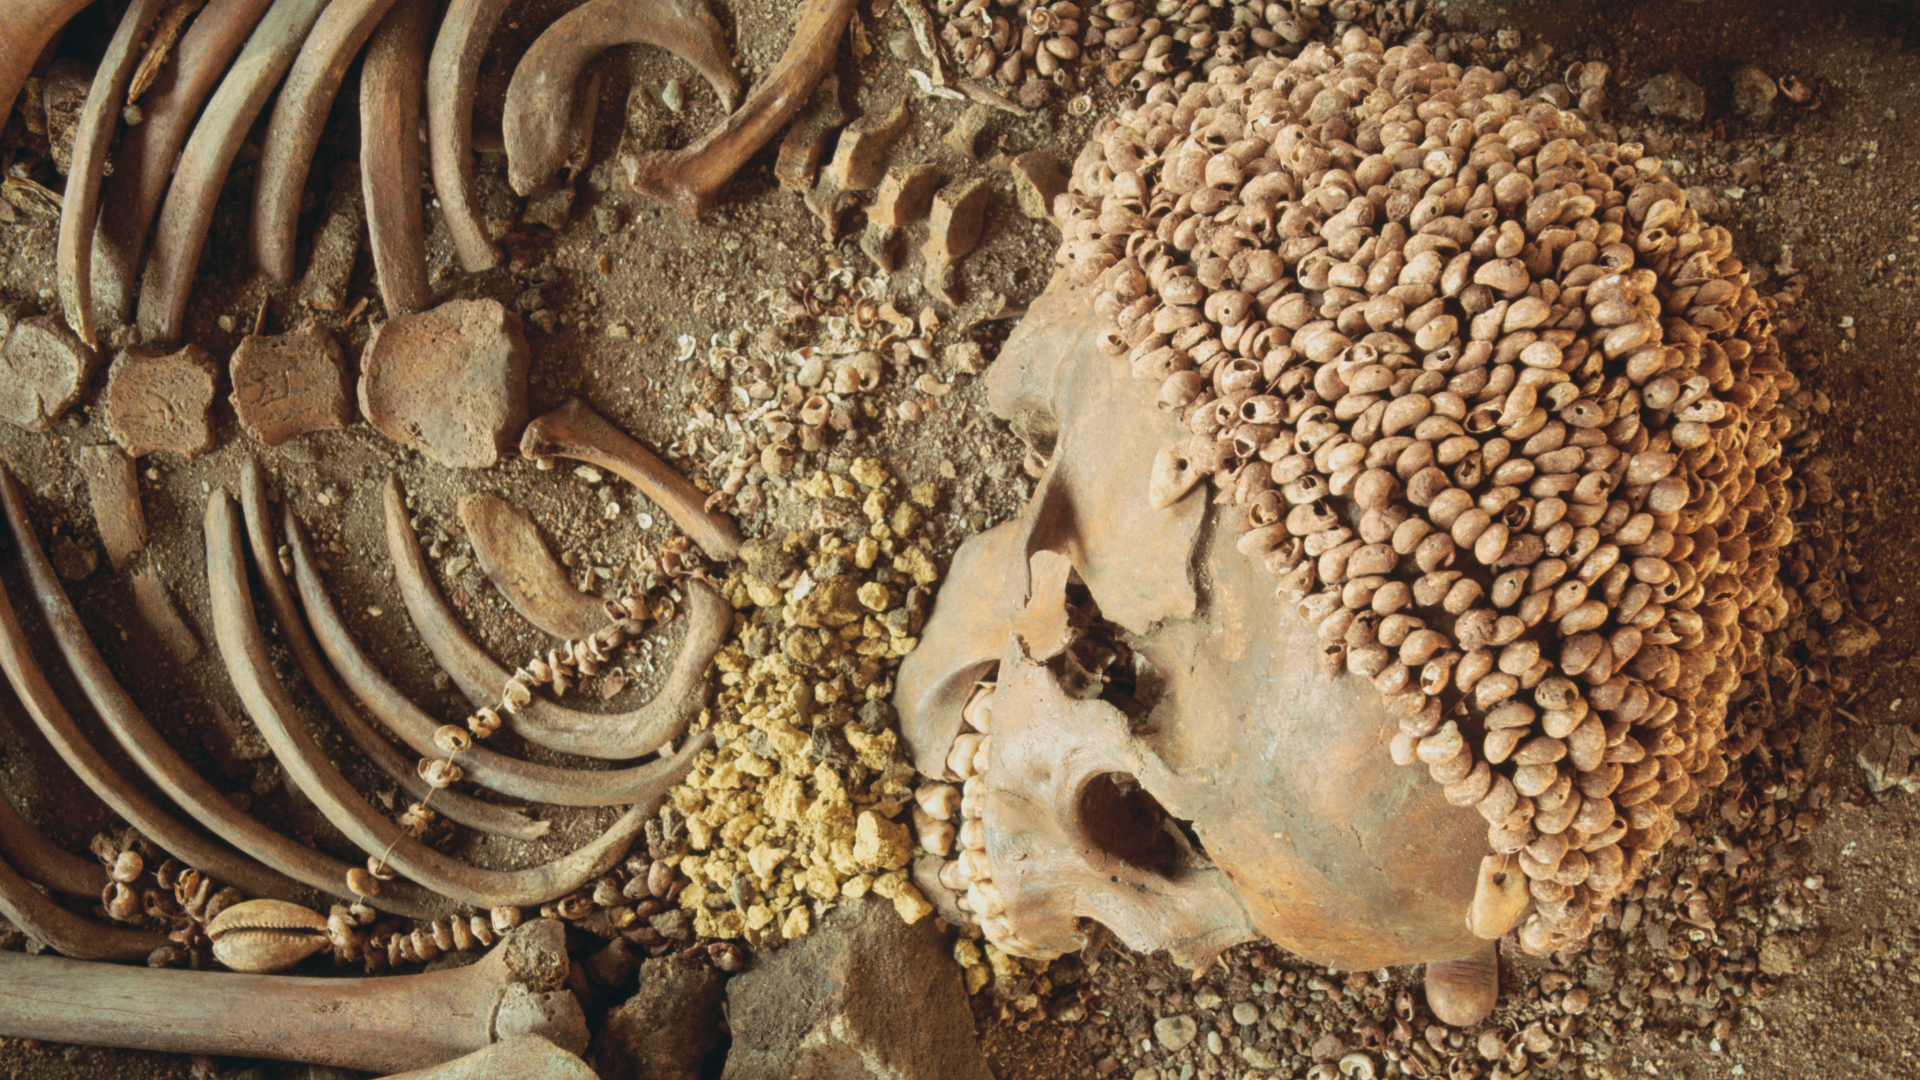
Stone Age teenager was mauled by a bear 28,000 years ago, skeletal analysis confirms
January 29, 2026
Study reveals how humans’ angry and happy voices affect dogs | National
January 29, 2026
Hospitality & Design Innovations Unveiled
January 29, 2026
PGYTECH Launches RetroVa on Kickstarter, Innovating Camera-Inspired Experience for Mobile Photography
January 29, 2026
‘Name a Cockroach after your ex’ returns at Chicago Zoo
January 29, 2026
U.S. sends additional warship to Middle East amid Iran tensions – Reuters
January 29, 2026
Bulls fall in final minute to Pacers 113-110 – NBA
January 29, 2026
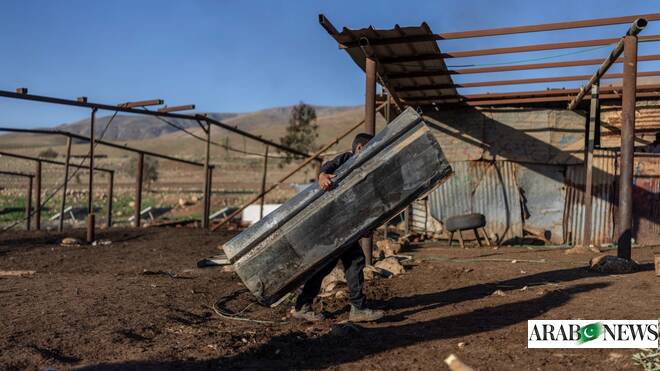
Israeli settlers attack Palestinian Bedouin community near Jerusalem – Arab News PK
January 29, 2026