Qaasid News
Download Our App
Latest News from Pakistan
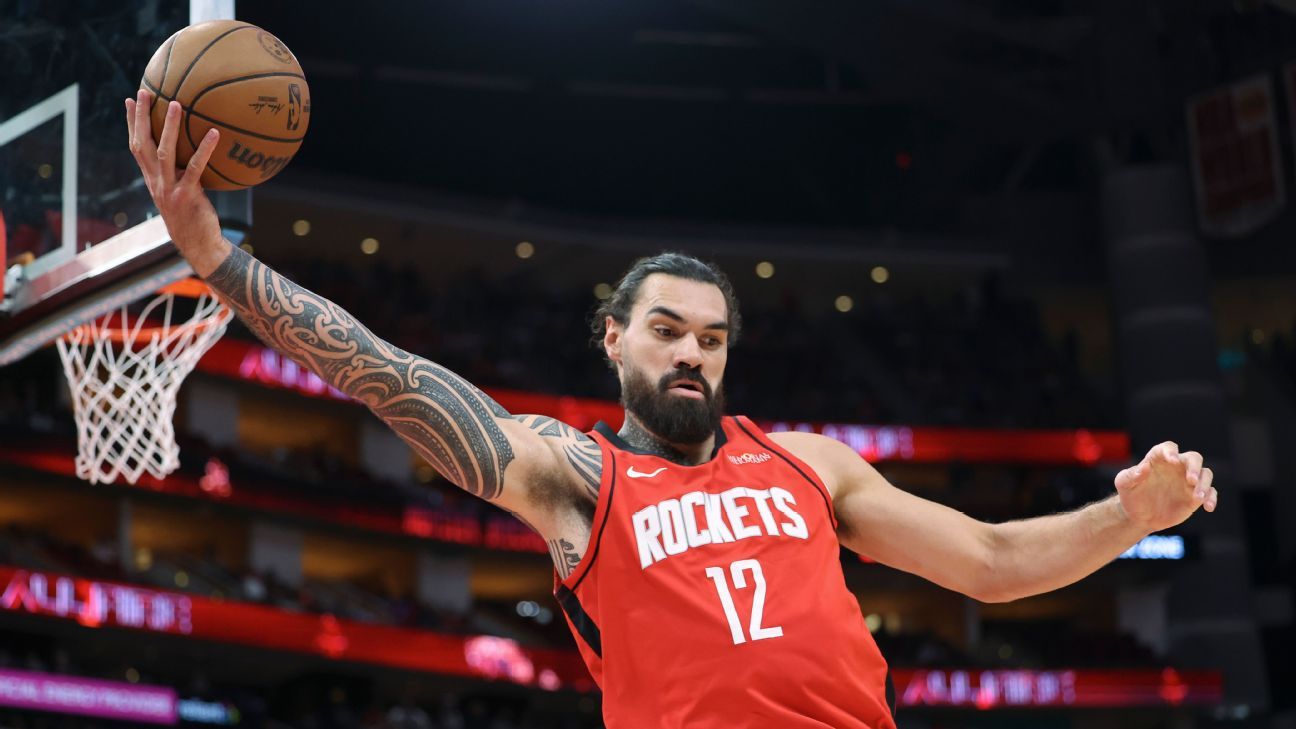
Sources: Rockets’ Steven Adams has season-ending surgery
January 28, 2026
A Cool Earth-sized Planet Candidate Transiting a Tenth Magnitude K-dwarf From K2 – astrobiology.com
January 28, 2026
$95M Payout: Apple Begins Compensating Users in Siri Eavesdropping Case – TechRepublic
January 28, 2026
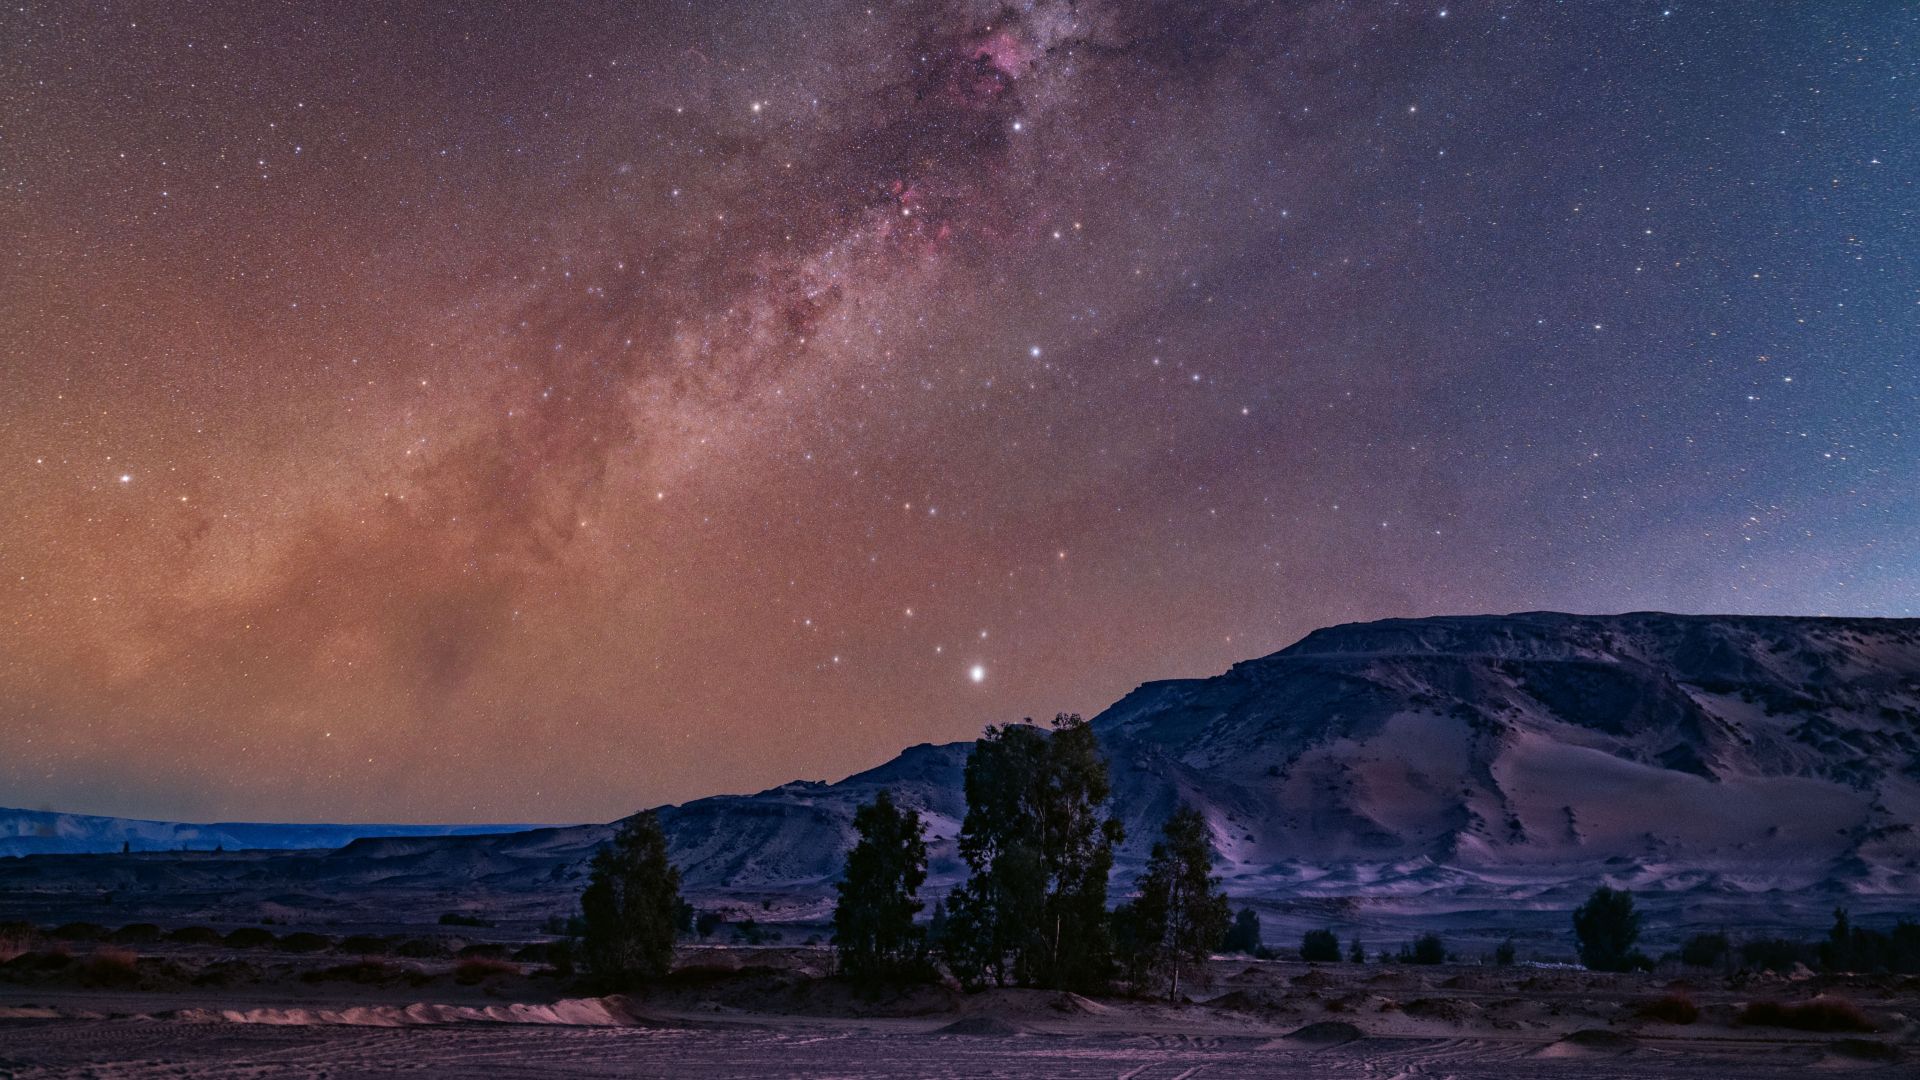
See the Milky Way glow with the stars of the Summer Triangle above Egypt’s Black Desert
January 28, 2026
Cognizant and Travel + Leisure Co. Renew Strategic Collaboration to Accelerate Digital Transformation
January 28, 2026
Women – AS FAR – Match Report
January 28, 2026
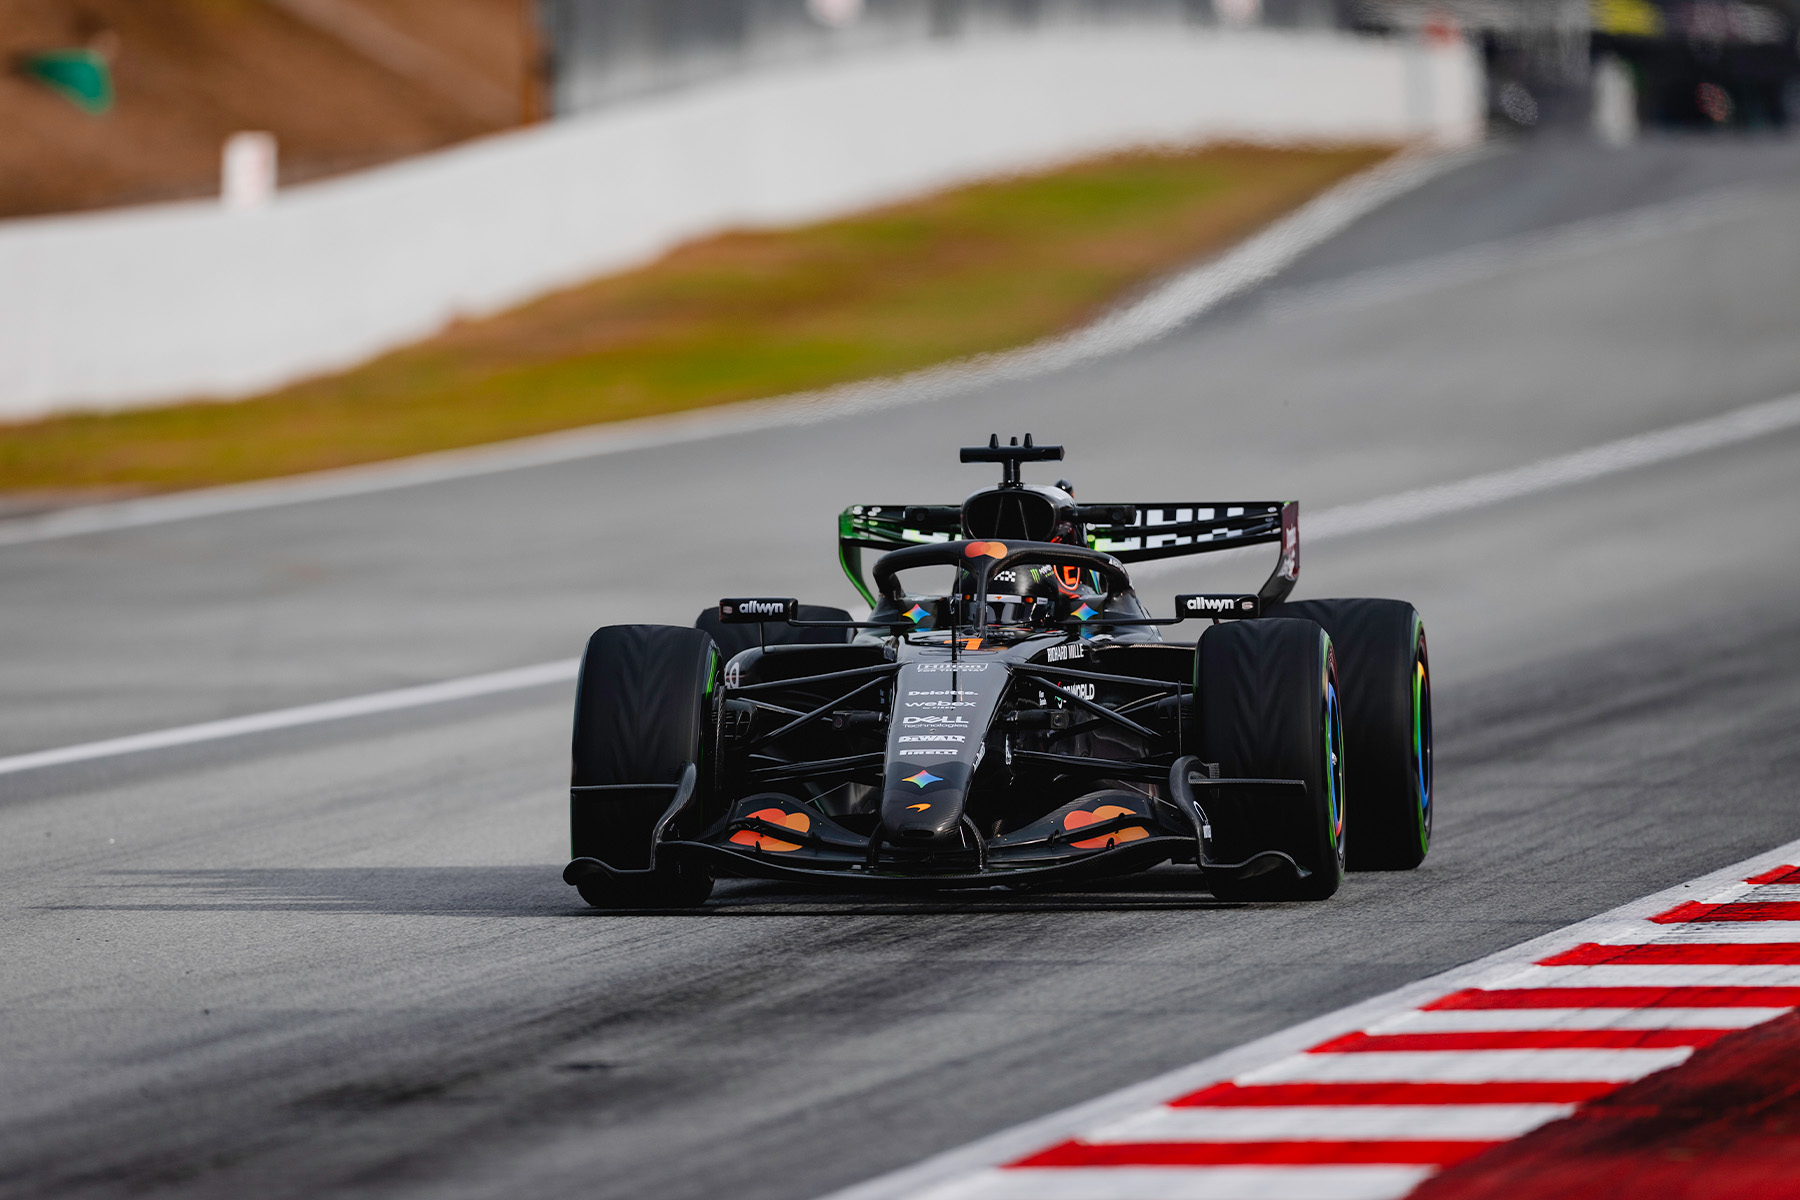
2026 Barcelona Pre-Season Shakedown – Day One
January 28, 2026
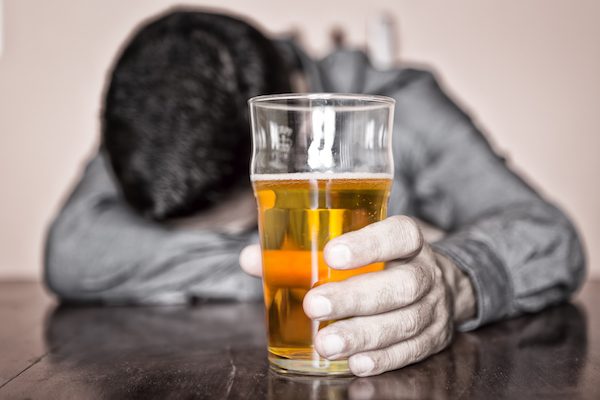
Islam’s Teachings About Alcohol and Modern Science
January 28, 2026
EQUAL: Smartwatch Monitoring Improves AFib Detection
January 28, 2026
Valentino Spring 2026 Couture Runway, Fashion Show & Collection Review
January 28, 2026