Qaasid News
Download Our App
Latest News from Pakistan
The women who saw Melania in theaters: ‘If you’re Republican, this is girls’ night’ | US news
February 7, 2026
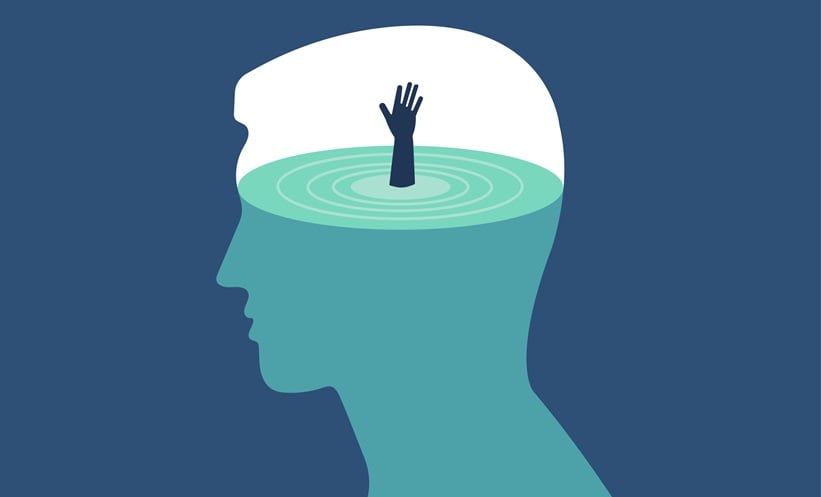
Survey suggests link between chatbot dependency and depression – Medical Xpress
February 7, 2026
What's next for the U.S. and Iran following preliminary talks? – NPR
February 7, 2026
A new social media platform creates buzz – but it's just for AI bots – NPR
February 7, 2026
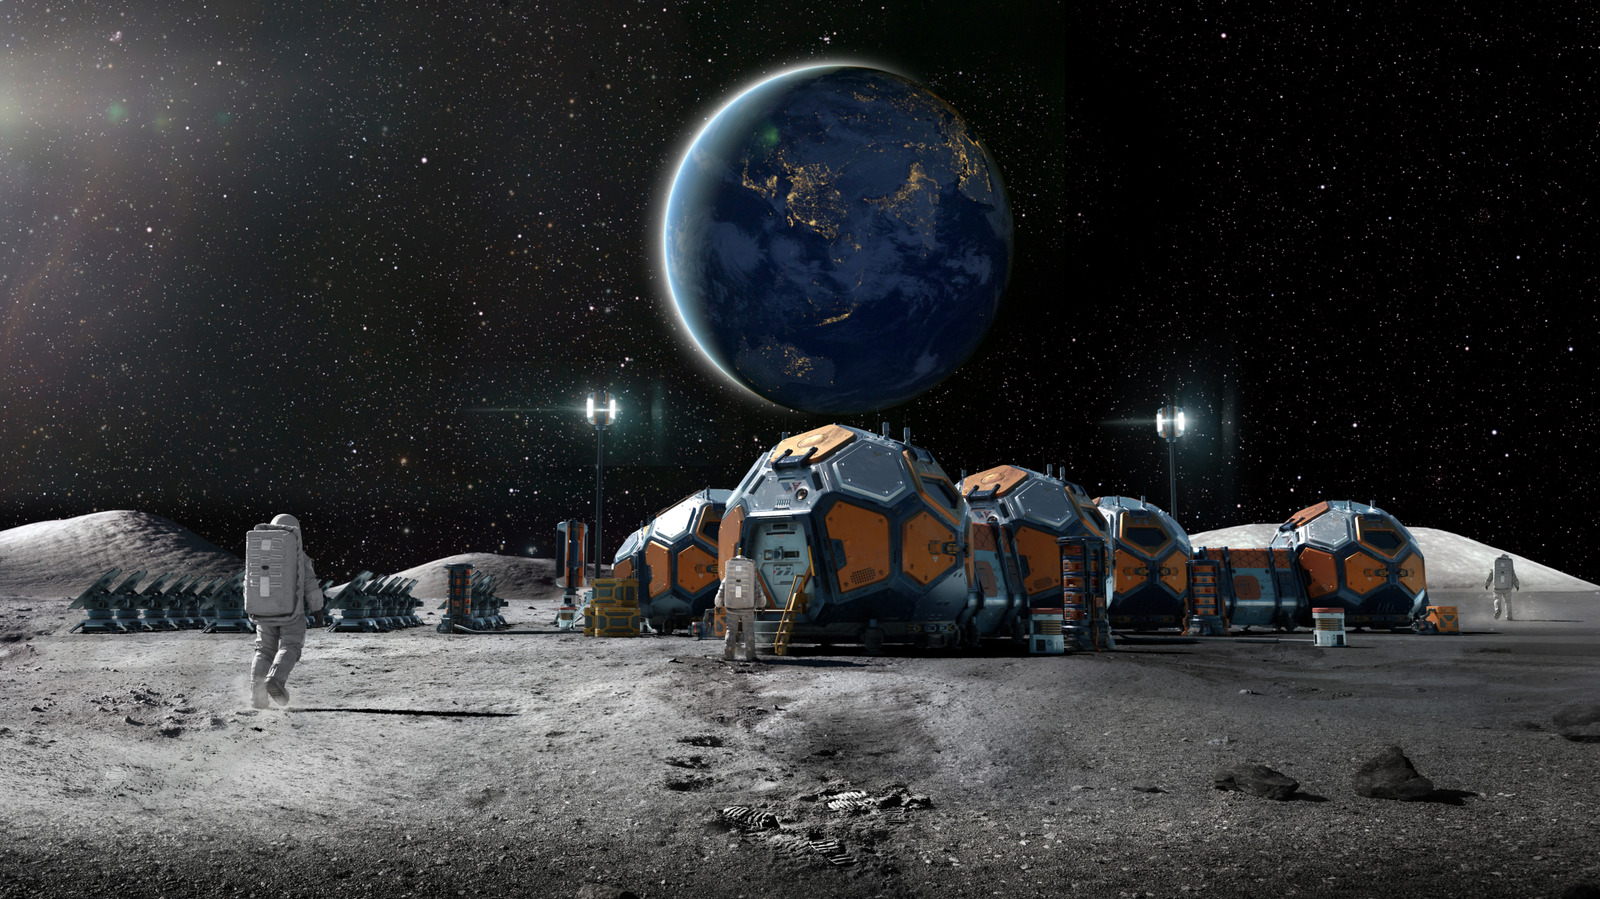
Why We’re Going Back To The Moon, According To NASA Astronauts
February 7, 2026
Sony’s Biggest QLED Screens See Big Discounts This Weekend
February 7, 2026
Iran blasts Israel amid US nuclear talks
February 7, 2026
If US attacks, Iran says it will strike US bases in the region – Reuters
February 7, 2026
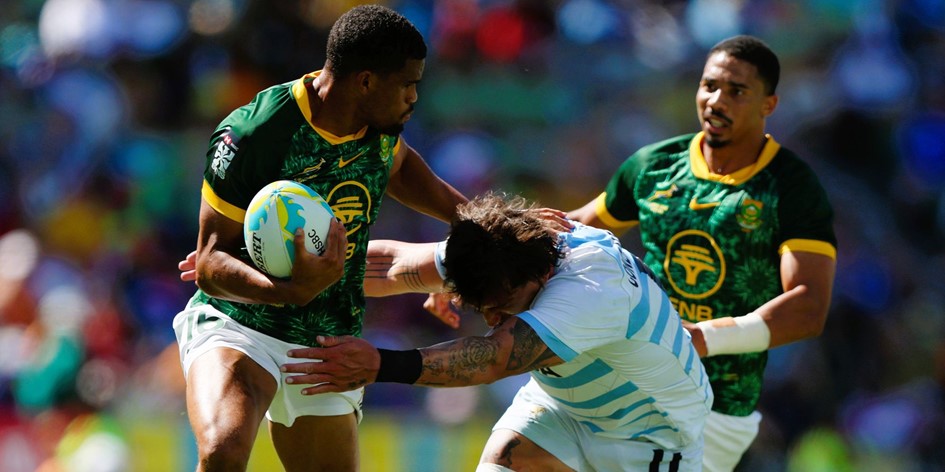
Blitzboks book Perth semi-final berth
February 7, 2026
Psychosocial Stress and Risk of Dementia and Stroke
February 7, 2026