Qaasid News
Download Our App
Latest News from Pakistan
Marvel Rivals Version 20260129 Patch Notes _Marvel Rivals
January 28, 2026
New Study Shows Air Fryers Produce Far Fewer Toxic Particles Than Frying – SciTechDaily
January 28, 2026
Guardian pair honoured for Noel Clarke coverage at Women in Journalism awards | Women in journalism
January 28, 2026
NBA Fantasy: DFS picks & advice for Jan. 28 – NBA
January 28, 2026
Pakistan, UAE vow to strengthen brotherly ties – RADIO PAKISTAN
January 28, 2026
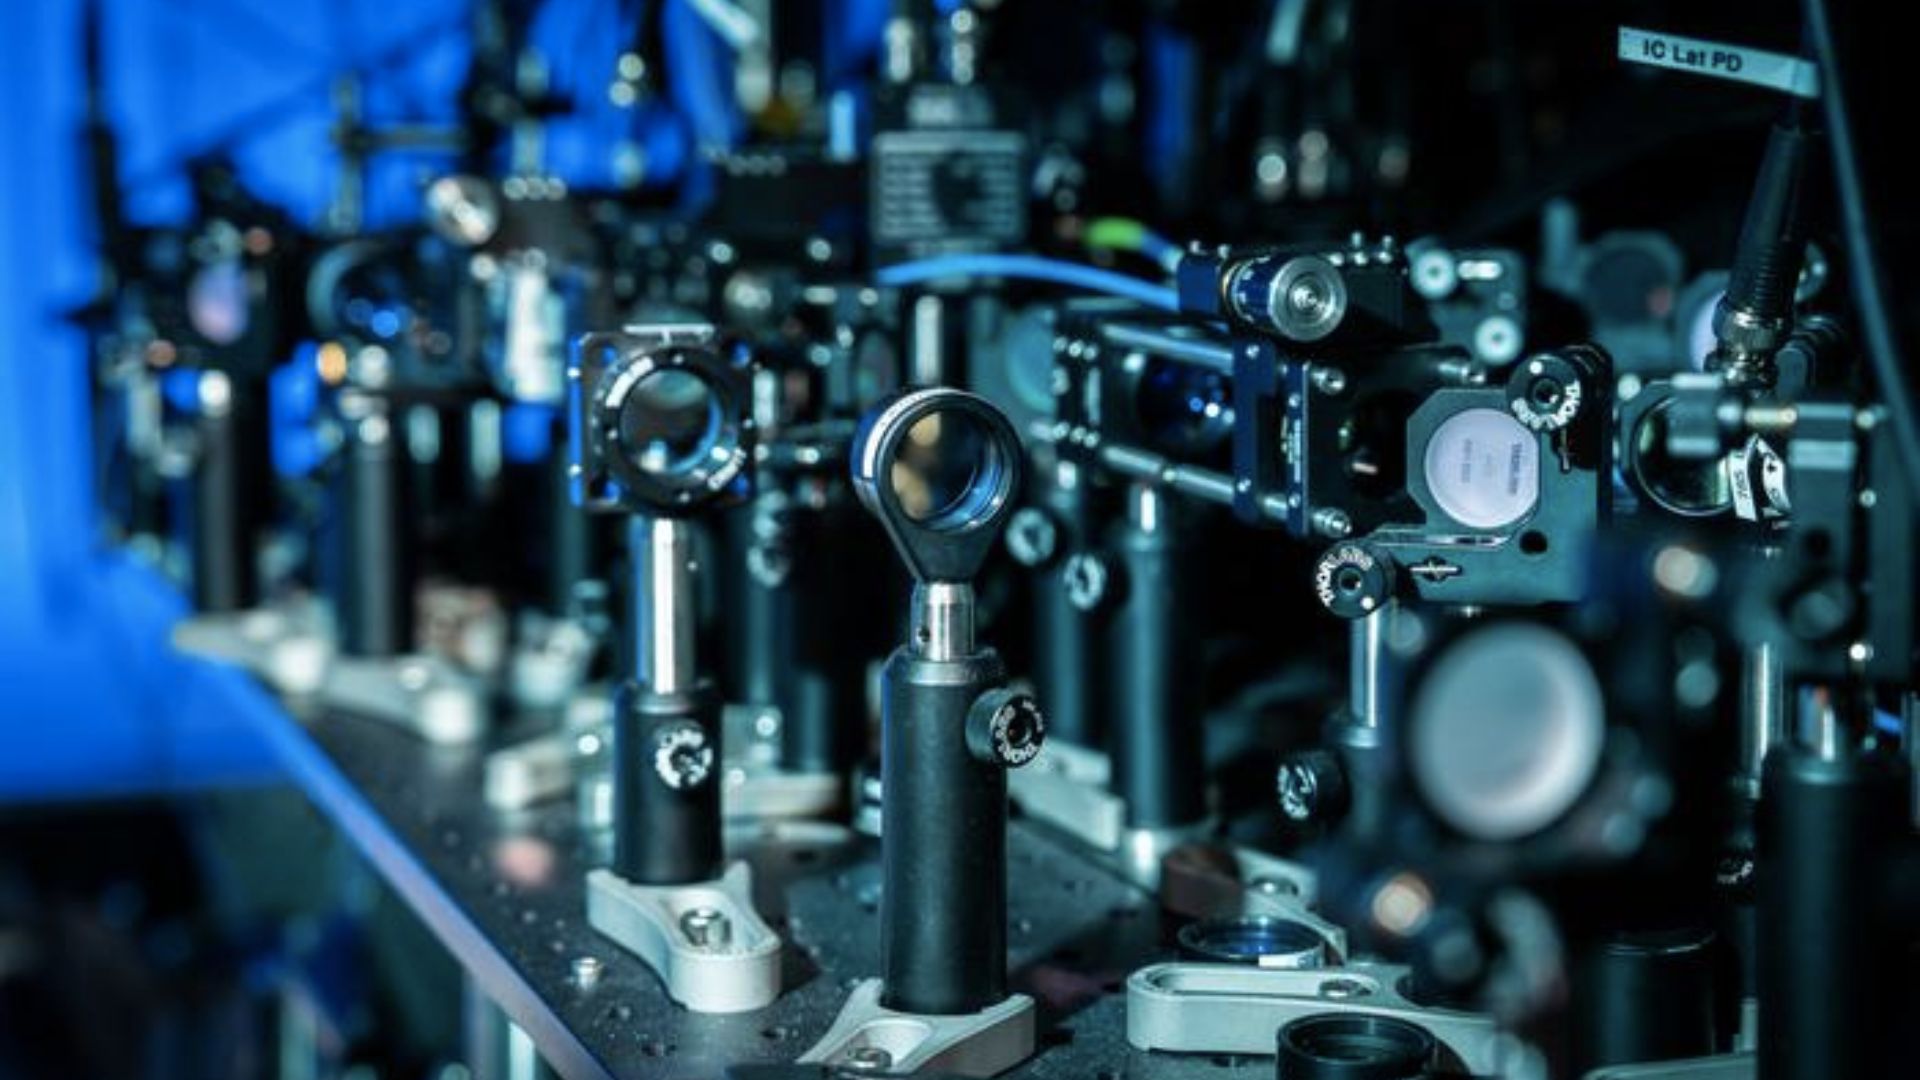
New ‘optical cavity’ can make million-qubit quantum computer network
January 28, 2026
Google, Apple hosted dozens of nudify apps, report reveals
January 28, 2026
Imran Khan’s party, government trade claims over ex-PM’s health and jail access – Arab News
January 28, 2026
Four big questions ahead of the 2026 Grammy Awards show – The Washington Post
January 28, 2026
UNPFII Chairperson Statement at the Dakar High Level Preparatory Meeting for the 2026 UN Water Conference
January 28, 2026