Qaasid News
Download Our App
Latest News from Pakistan
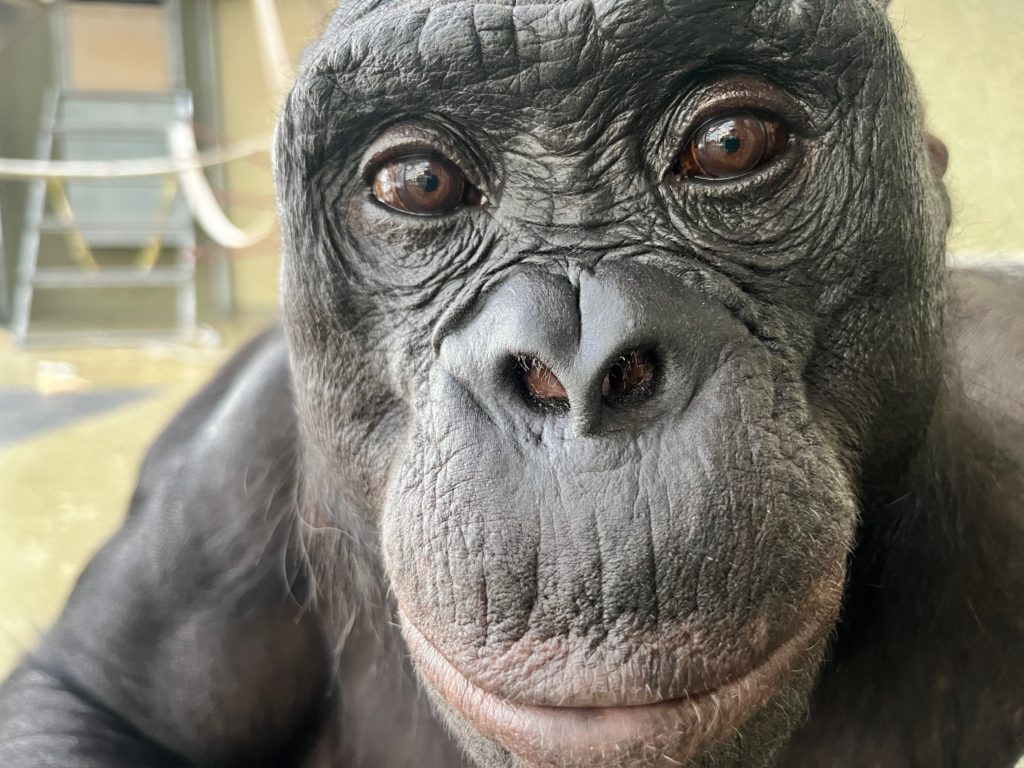
Can apes play pretend? Scientists use an imaginary tea party to find out
February 6, 2026
Submissions Open for the 2026 Swift Student Challenge – MacStories
February 6, 2026
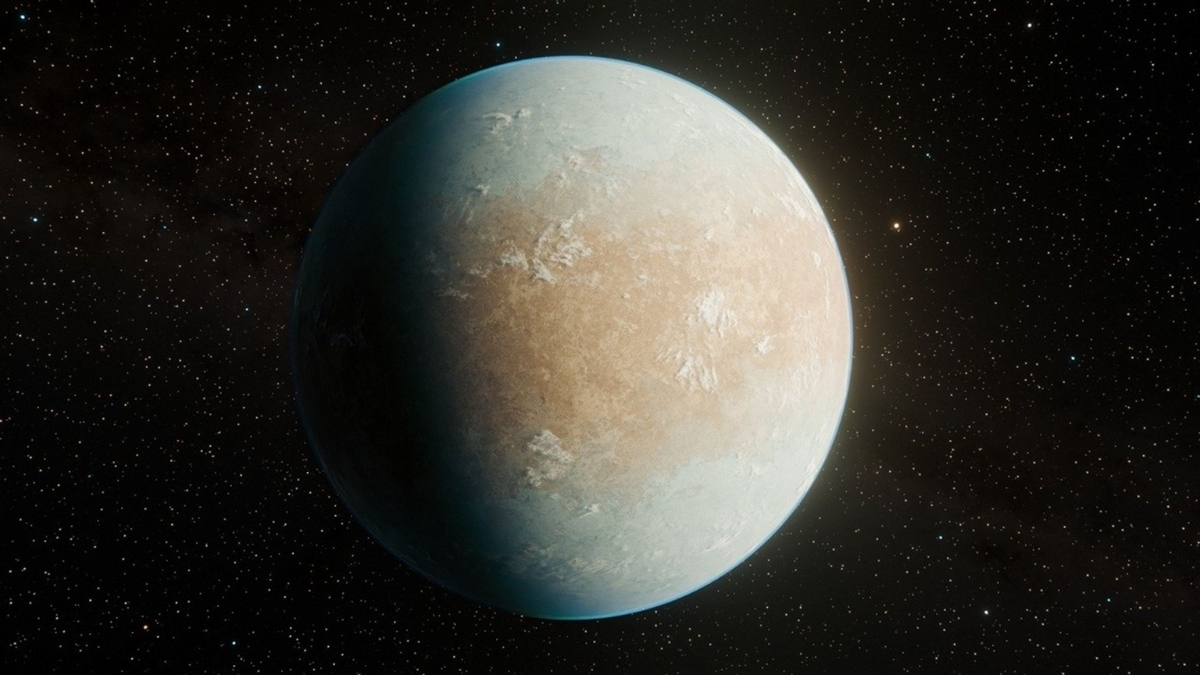
Scientists Reveal a Frozen Bizarro Earth Only 150 Light-Years Away : ScienceAlert
February 6, 2026
Abundant Hydrocarbons In A Buried Galactic Nucleus With Signs Of Carbonaceous Grain And Polycyclic Aromatic Hydrocarbon Processing – astrobiology.com
February 6, 2026
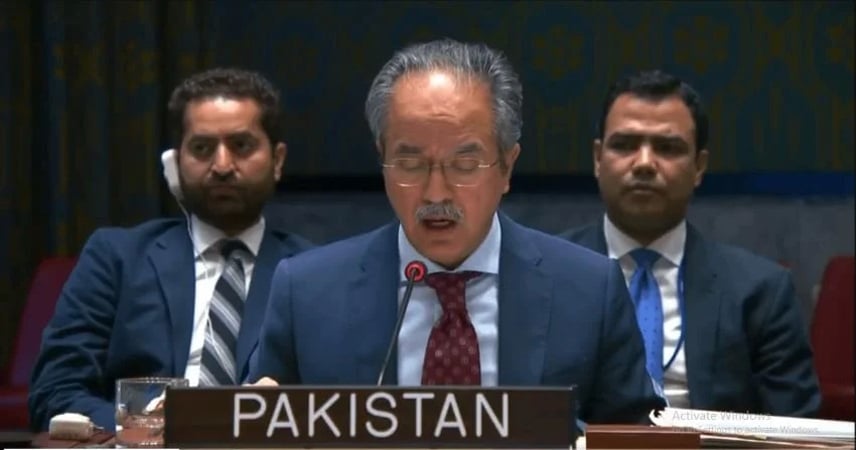
Pakistan warns UN police budget cuts risk undermining peacekeeping
February 6, 2026
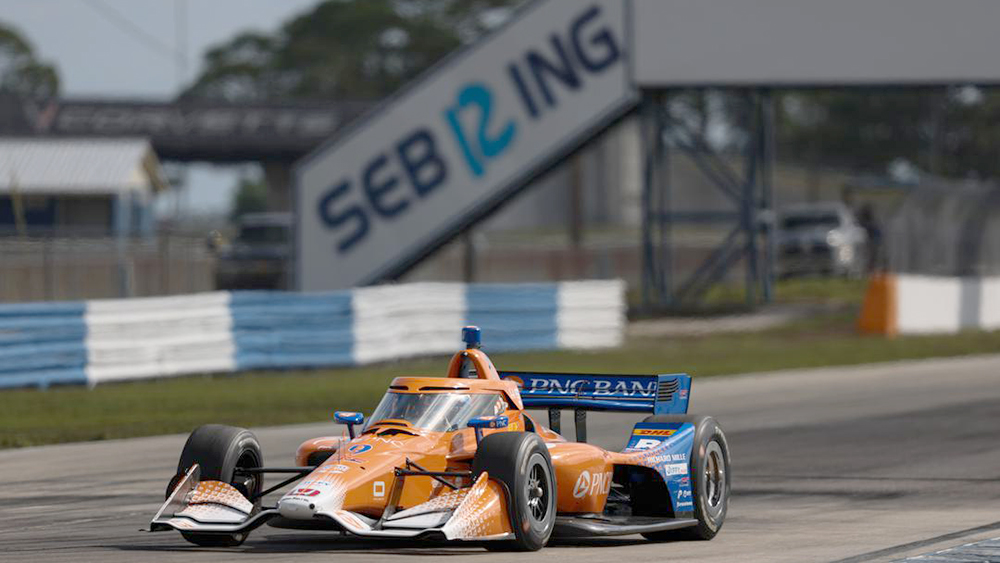
Testing Kicks Into Overdrive Next Week as Season Approaches
February 6, 2026
Austin Butler to play Lance Armstrong in big-screen biopic | Austin Butler
February 6, 2026
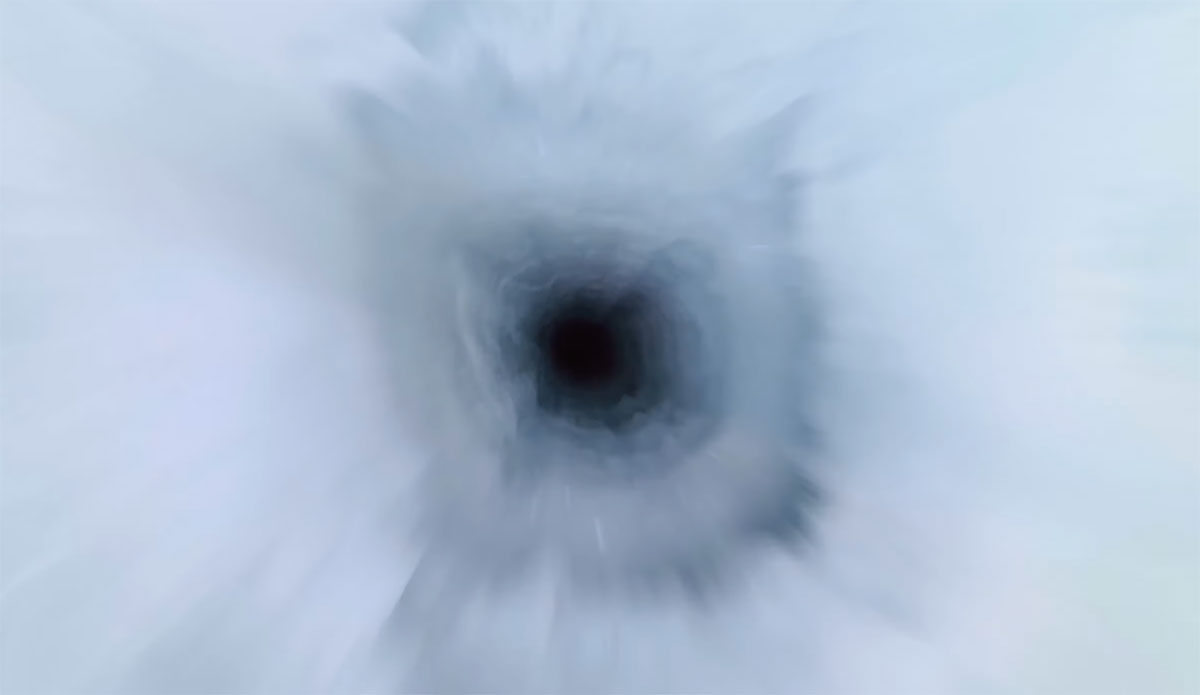
Researchers Dropped a Camera 3,300 Feet Down a Borehole
February 6, 2026
Google debuts special doodle for ICC Men’s T20 World Cup
February 6, 2026
Max Richter: the composer who crosses the invisible divide between ‘high’ and ‘low’ music | Music
February 6, 2026