Qaasid News
Download Our App
Latest News from Pakistan
NASA’s Artemis II crewed mission to the Moon shows how US space strategy has changed since Apollo – and contrasts with China’s closed program
January 27, 2026
French lawmakers approve bill banning social media for children under 15
January 27, 2026
Saudi CMA approves new controls on real estate ownership – Global Regulation Tomorrow
January 27, 2026
Confirmed: full 2026 testing calendar
January 27, 2026
Financial incentives lower blood sugar in uncontrolled type 2 diabetes
January 27, 2026
Army has nothing to do with Tirah valley migration: Asif – RADIO PAKISTAN
January 27, 2026
Teva Pharmaceutical Industries Ltd. – Will Forte Teams Up with Teva to Get Real About Huntington’s Disease with ‘Honestly HD’
January 27, 2026
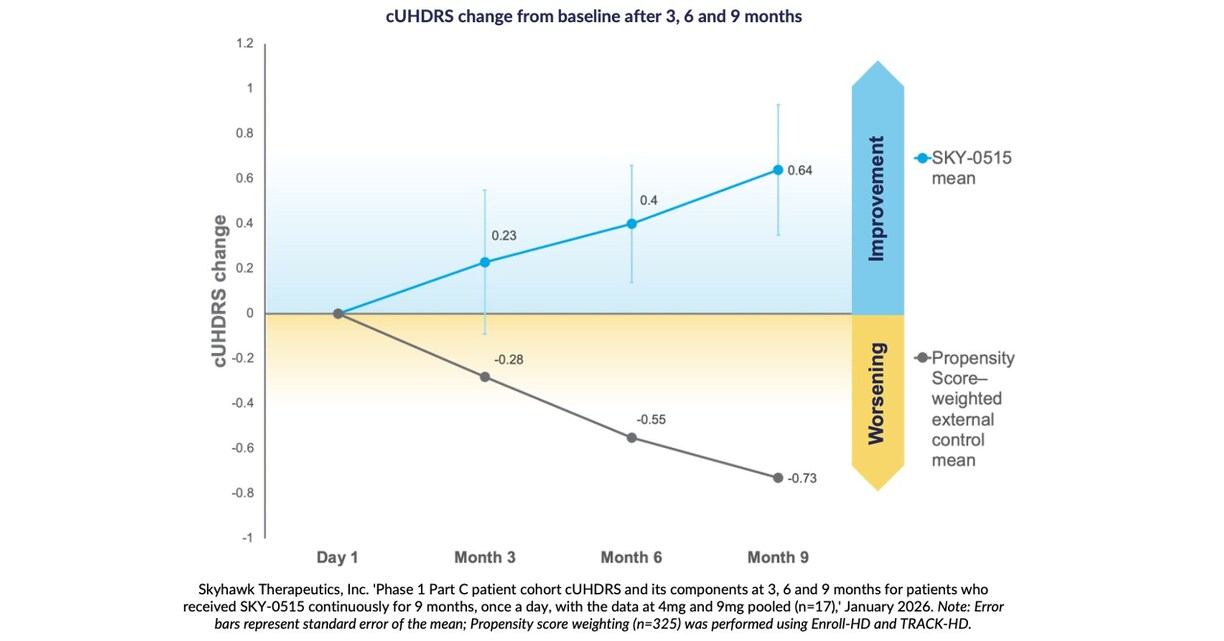
Skyhawk Therapeutics Announces Nine Month Interim Results in Patients from its Phase 1 Clinical Trial of SKY-0515 as a Treatment for Huntington’s Disease USA – English APAC – English Korea – 한국어 USA – English
January 27, 2026
NASA technology sparks a new golden age of exploration on Earth
January 27, 2026
Felix Loch and Julia Taubitz hope to continue German dominance – full schedule, how to watch live
January 27, 2026