Qaasid News
Download Our App
Latest News from Pakistan
Pharrell Williams sued by former Neptunes partner Chad Hugo over alleged lost earnings | Pharrell Williams
January 26, 2026
41 Punjab MPs back in Assembly, nine suspended for asset default – Minute Mirror
January 26, 2026
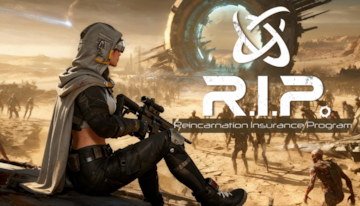
Vampire Survivors meets Diablo in fast-paced, roguelike, bullet heaven looter R.I.P., out now on Early Access
January 26, 2026
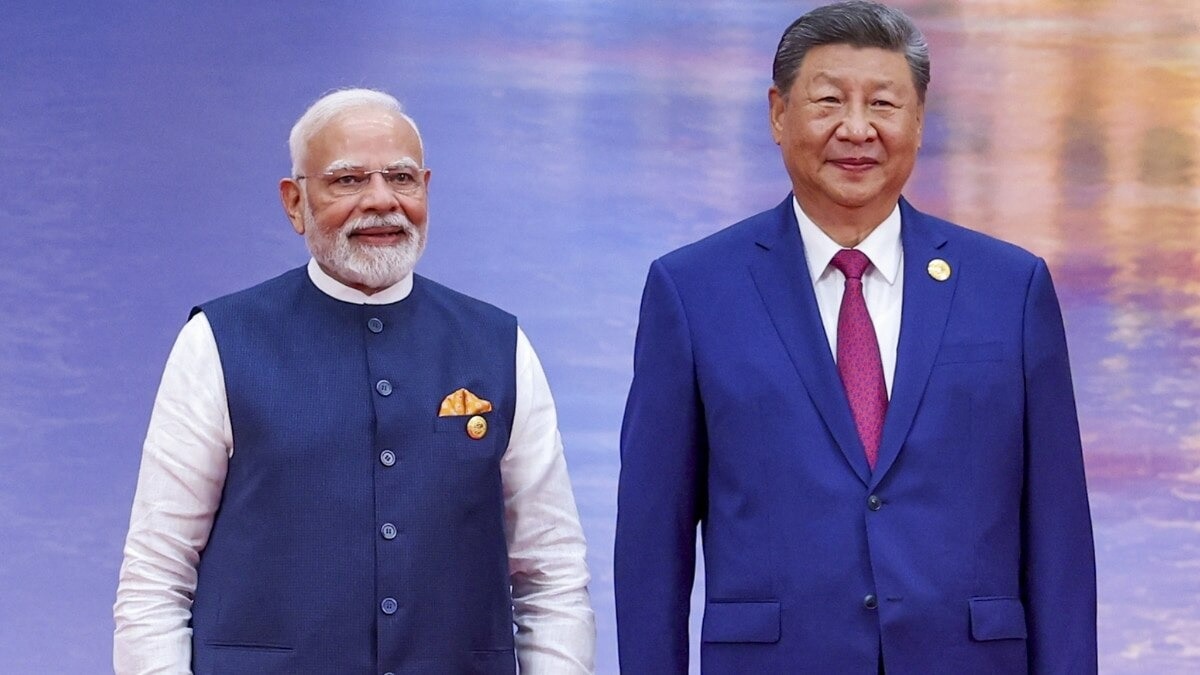
India China relations Republic Day: Xi Jinping on renewed cooperation and border dialogue after Ladakh standoff
January 26, 2026
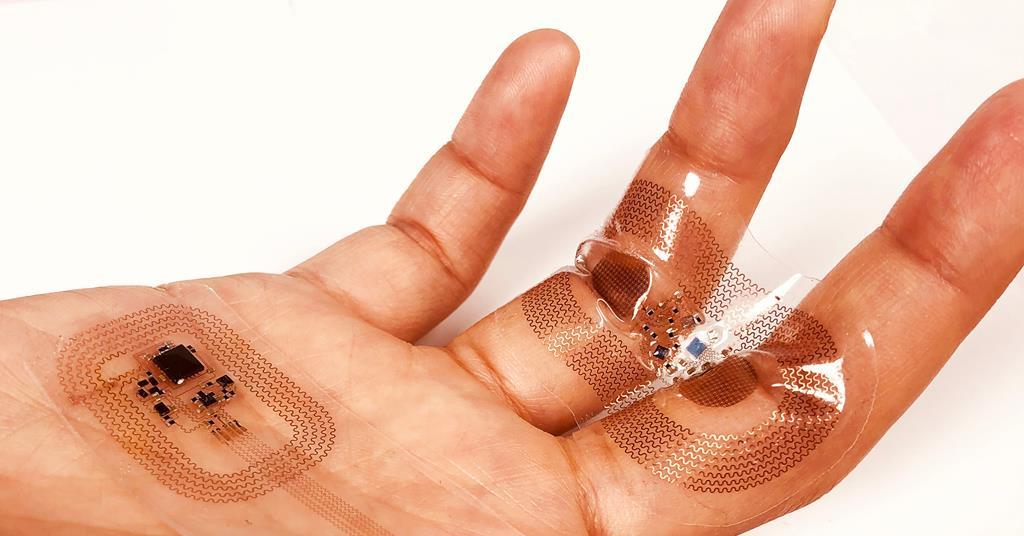
Soft electronics and conductive polymers transform medical devices
January 26, 2026
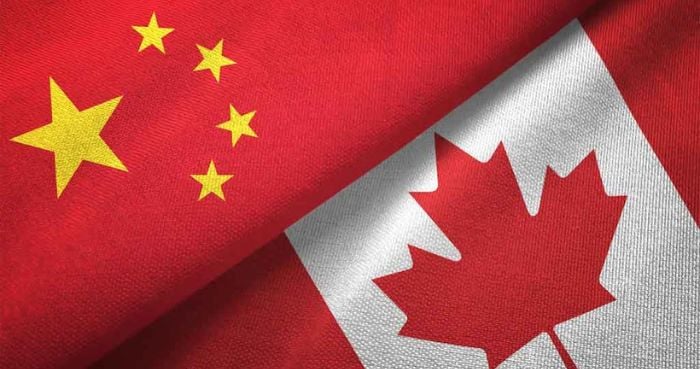
China says Canada deal not aimed at US after tariff threat
January 26, 2026
Ishaq Dar, Than Swe sign MoU on political consultations – RADIO PAKISTAN
January 26, 2026
Reducing sodium in everyday foods may yield heart-health benefits across populations
January 26, 2026
Punjab bans 132 ‘suggestive’ songs during Basant celebrations
January 26, 2026
Audi sign F3 racer Freddie Slater as first recruit of Audi Driver Development Programme
January 26, 2026