Qaasid News
Download Our App
Latest News from Pakistan
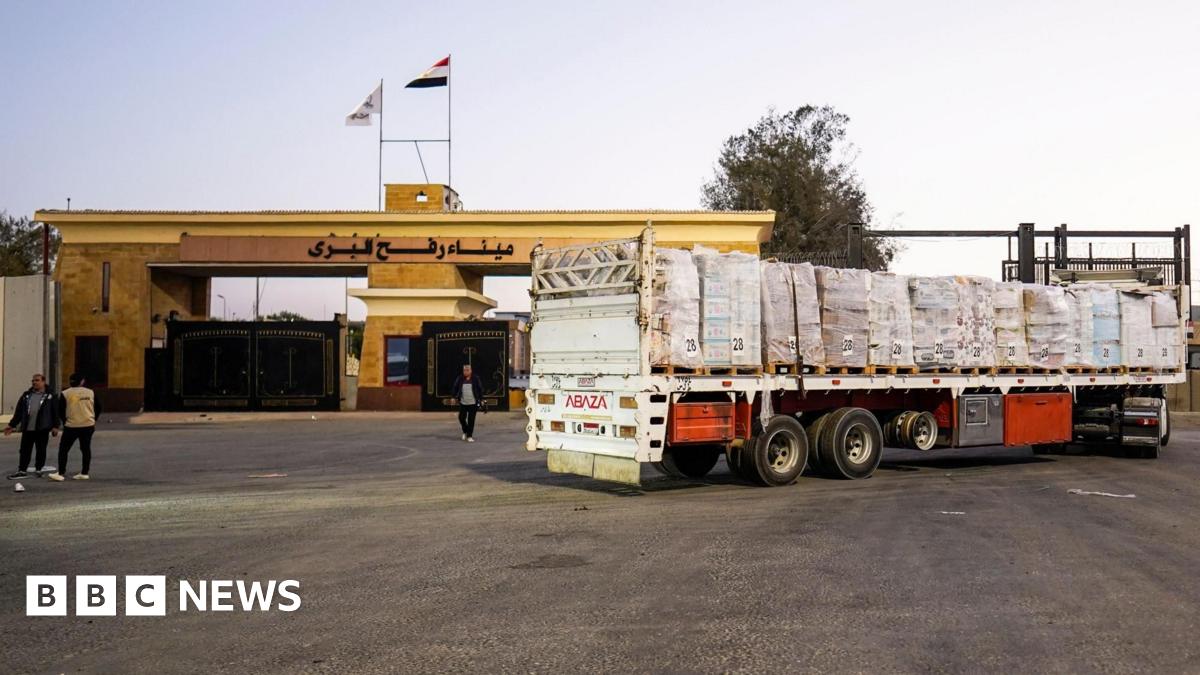
Israel to reopen Gaza crossing after search for hostage’s body ends
January 26, 2026
Resolution of Kashmir dispute vital for regional peace: Qasim Noon – RADIO PAKISTAN
January 26, 2026
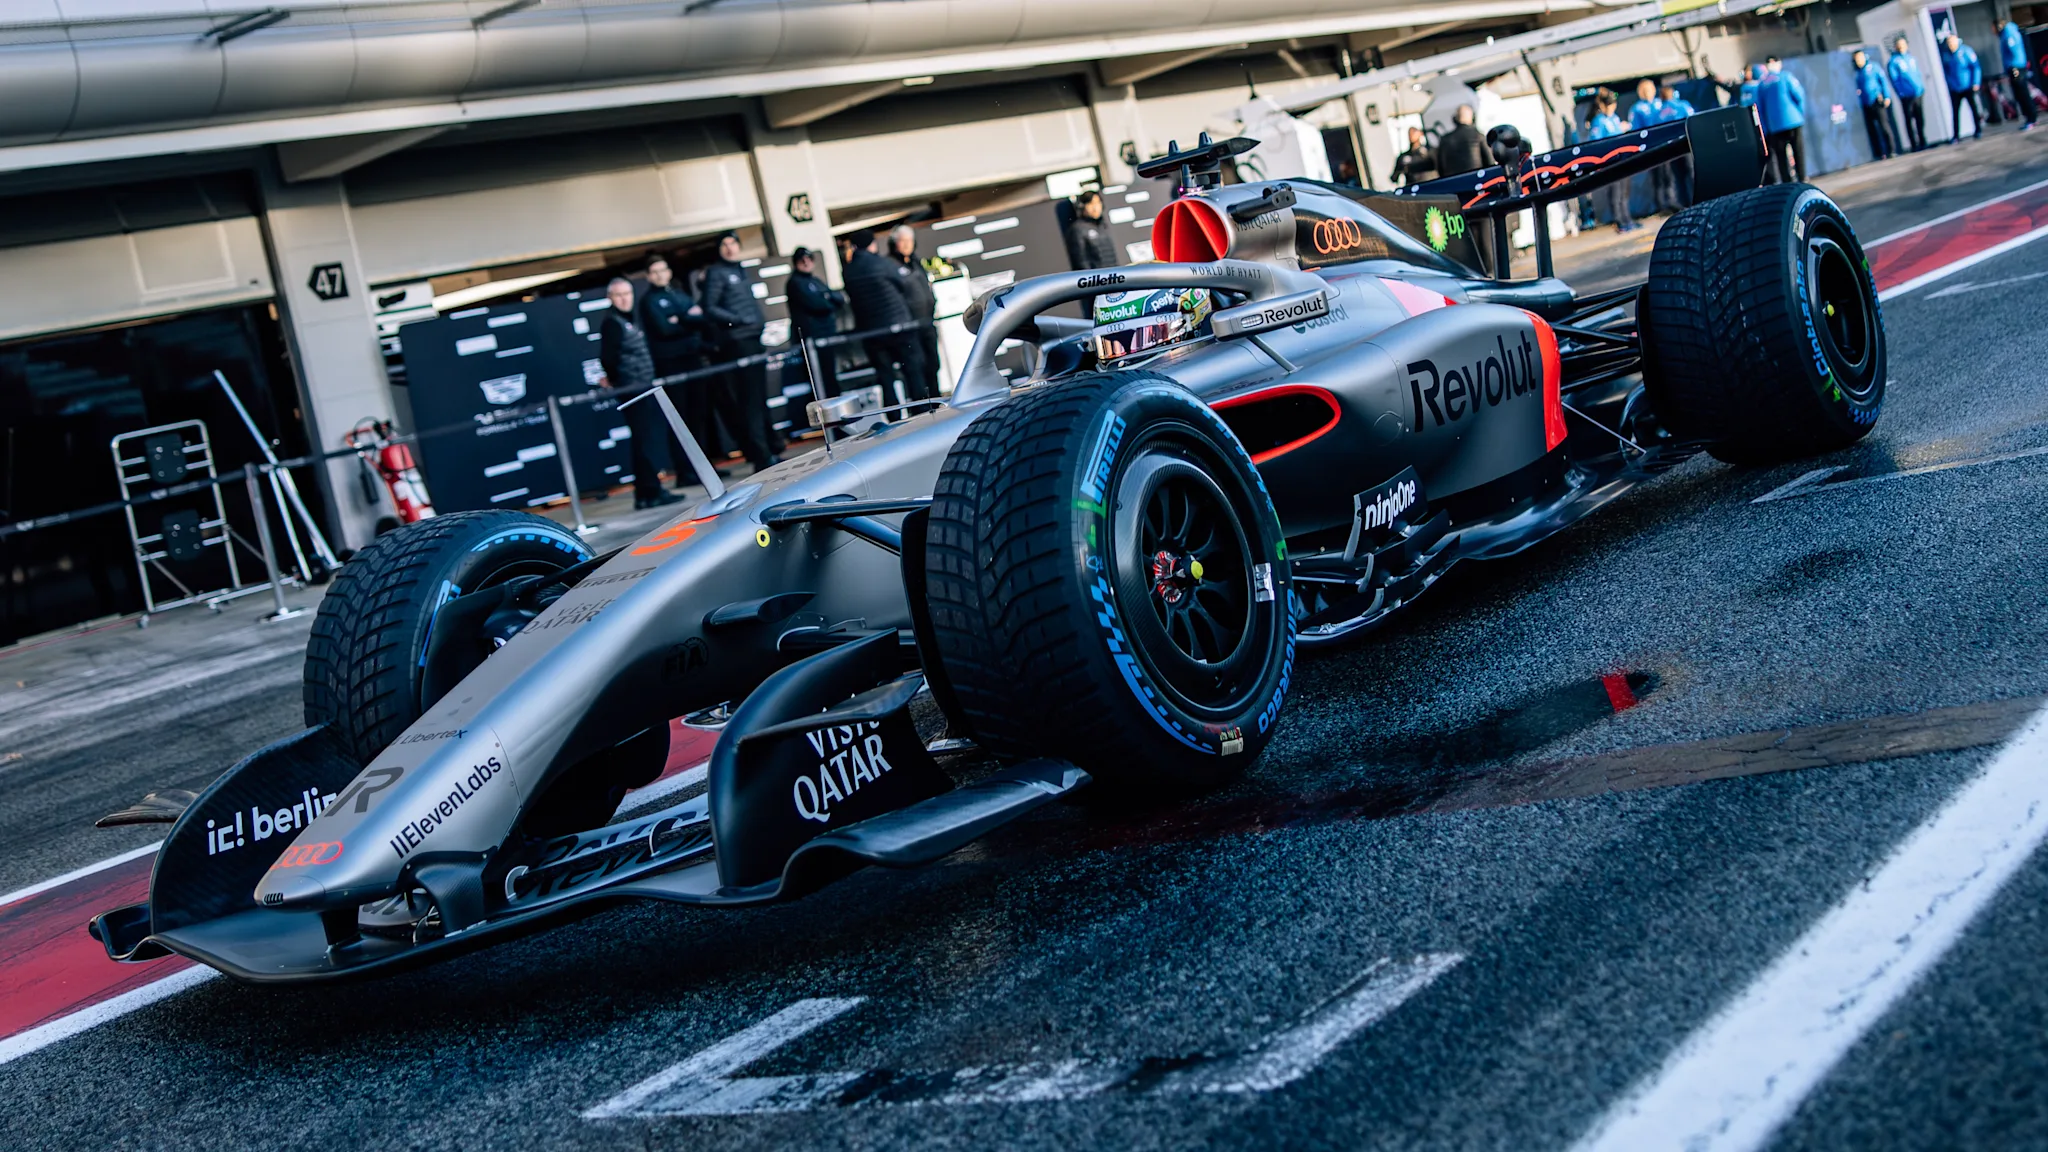
See the 2026 cars emerge on track for the first time at the Barcelona Shakedown
January 26, 2026
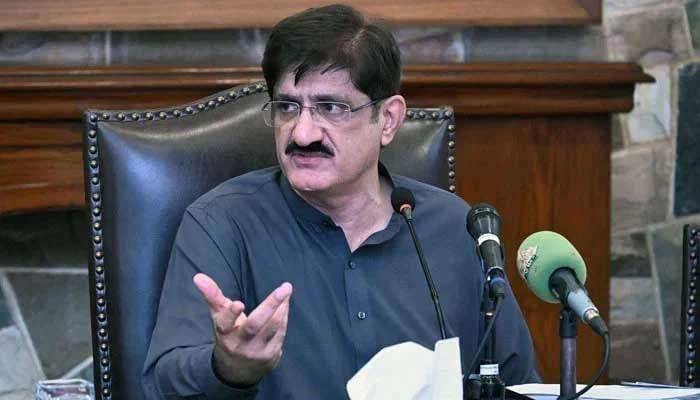
CM Sindh to inaugurate new Korangi Causeway Bridge
January 26, 2026
Full List of Theatre Shows and Dates, How to Get Tickets
January 26, 2026
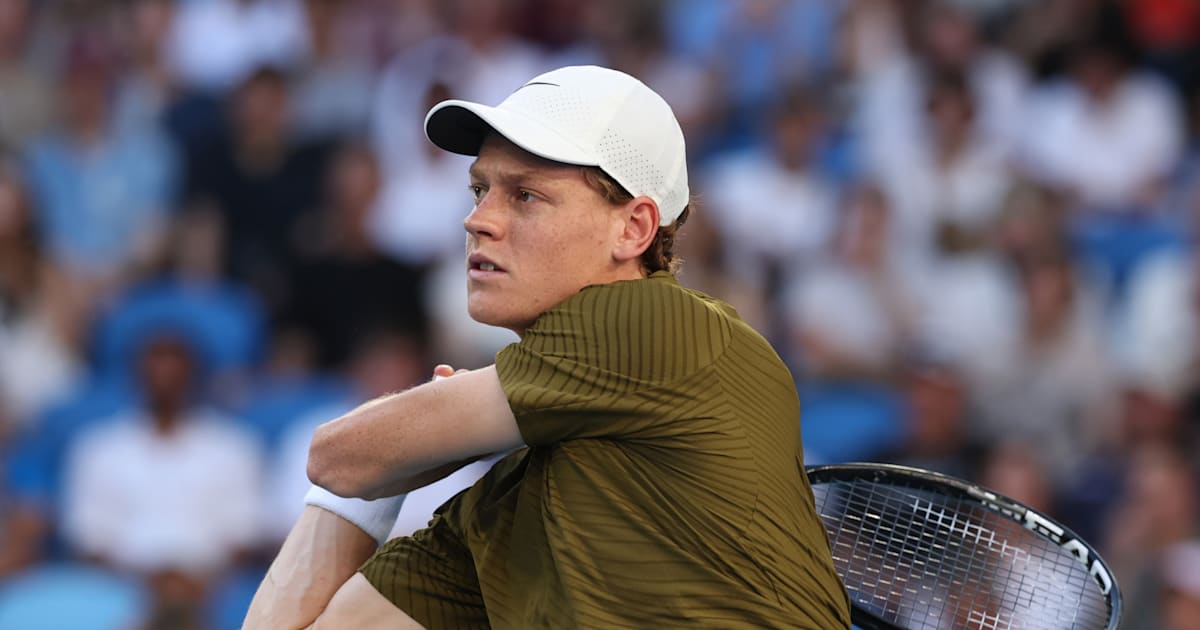
Australian Open 2026: Jannik Sinner prevails in all-Italian fourth round matchup with Luciano Darderi – olympics.com
January 26, 2026
FIA welcomes leading tyre manufacturer Hankook to Global Partner Programme
January 26, 2026
Epic Games & Google Reveal $800 Million Deal Amid Lawsuit
January 26, 2026
CM to inaugurate Korangi Causeway Bridge today
January 26, 2026
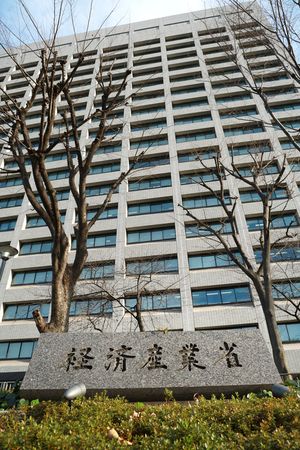
Japan Content Piracy, Fake Goods Cause 10.4 T. Yen in Damage
January 26, 2026