Qaasid News
Download Our App
Latest News from Pakistan
Australian Open 2026: Jannik Sinner prevails in all-Italian fourth round matchup with Luciano Darderi – olympics.com
January 26, 2026
FIA welcomes leading tyre manufacturer Hankook to Global Partner Programme
January 26, 2026
Epic Games & Google Reveal $800 Million Deal Amid Lawsuit
January 26, 2026
CM to inaugurate Korangi Causeway Bridge today
January 26, 2026
Japan Content Piracy, Fake Goods Cause 10.4 T. Yen in Damage
January 26, 2026
Search operation continues after landslide Kills at least 30, leaving 100 missing
January 26, 2026
Dar, Myanmar FM hold ‘very productive’ talks in Islamabad as Pakistan seeks to revitalise ties – Dawn
January 26, 2026
Pan Fiction publishing director Trish Jackson to retire after 25 years
January 26, 2026
Property cat reinsurance softening to continue into April, June and July renewals, says Fitch
January 26, 2026
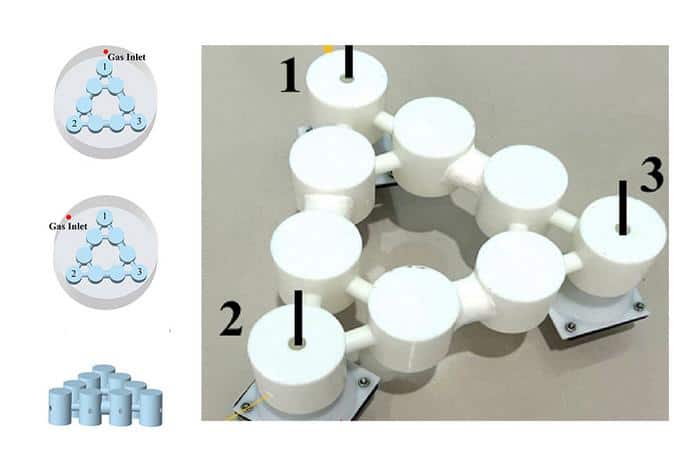
New sensor uses topological material to detect helium leaks – Physics World
January 26, 2026