Qaasid News
Download Our App
Latest News from Pakistan
Australian Open 2026: Full order of play, Monday 26 January
January 25, 2026
Pinpointing the key factors in Thoroughbred pregnancy loss
January 25, 2026
Focusrite Forte USB Audio Interface To Be Supported By Linux 7.0
January 25, 2026
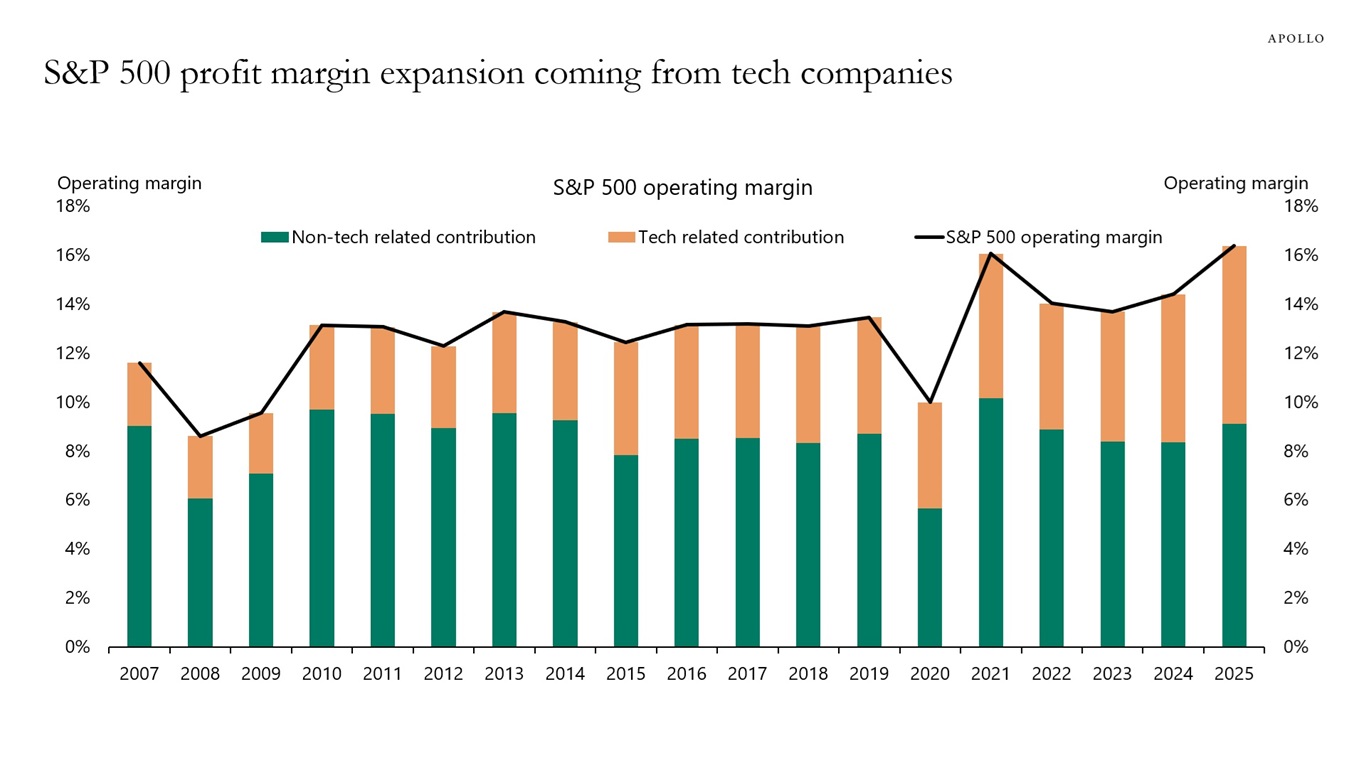
S&P 500 Margin Expansion All Coming from Tech
January 25, 2026
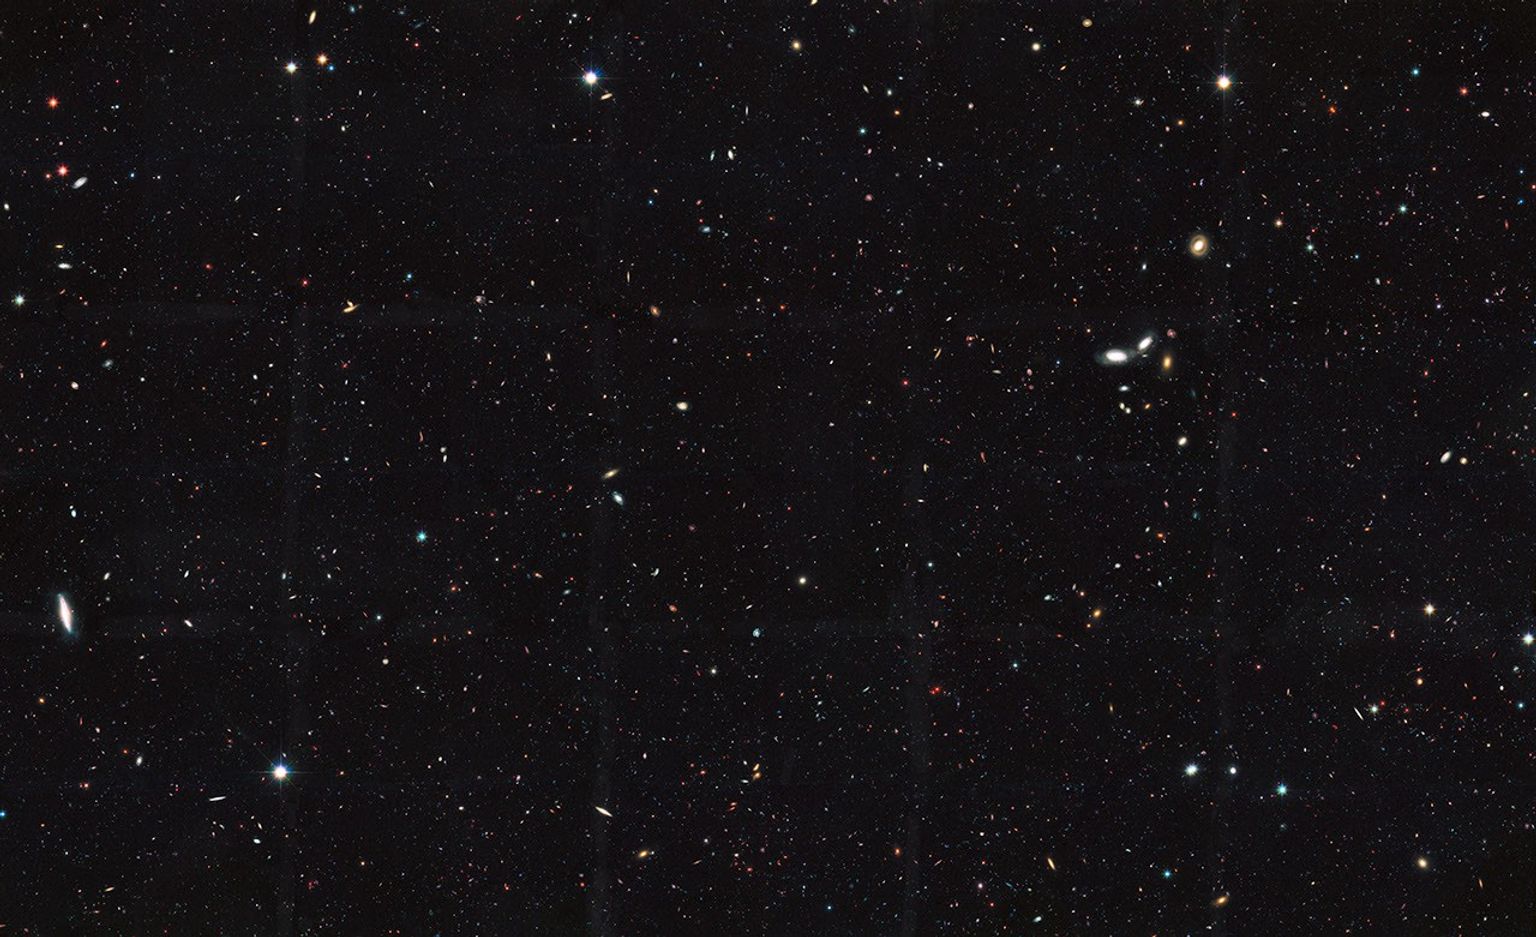
Scientist Says Heaven May Exist at the Edge of the Observable Universe
January 25, 2026
PTA warns public against illegal online content
January 25, 2026
Amazon’s internet-beaming satellites are bright enough to disrupt astronomical research, study finds
January 25, 2026
James Webb telescope peers into ‘Eye of God’ and finds clues to life’s origins — Space photo of the week
January 25, 2026
Sources: Broncos’ Bo Nix sidelined 12 weeks after ankle surgery
January 25, 2026
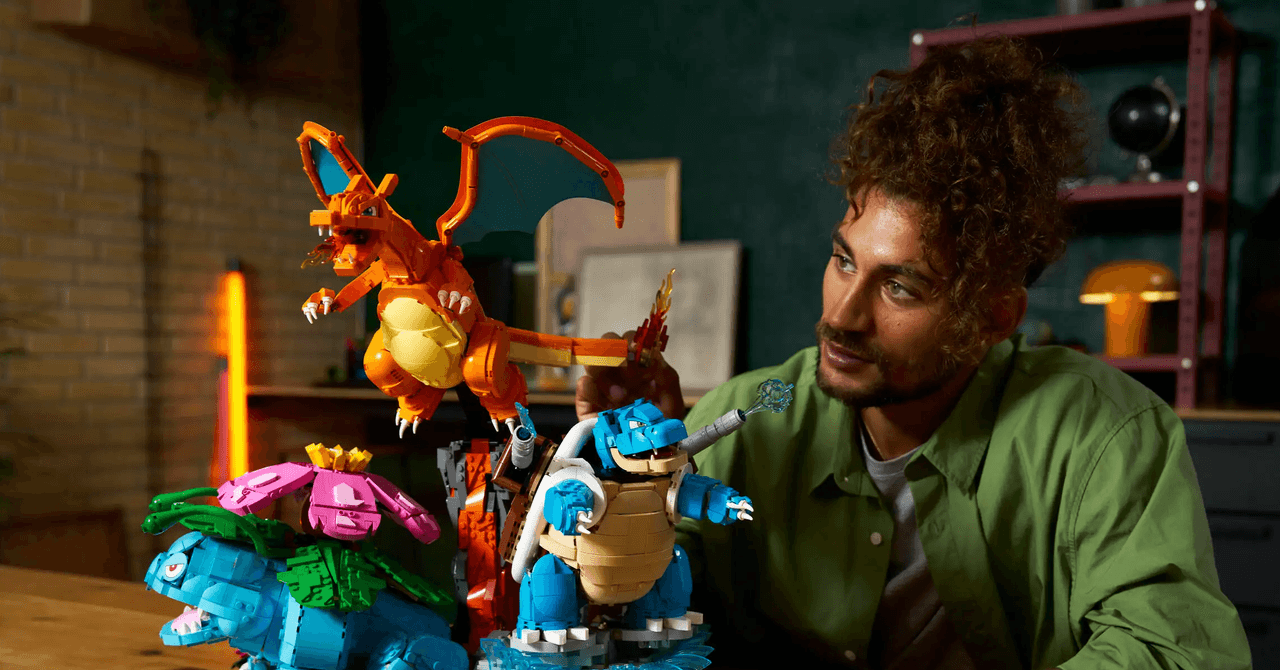
The Lego Pokémon Line Shows Toys Are Only for Rich Adults Now
January 25, 2026