Qaasid News
Download Our App
Latest News from Pakistan
Valuation Revisited After Q3 Revenue Surge and Raised Growth Outlook
November 15, 2025
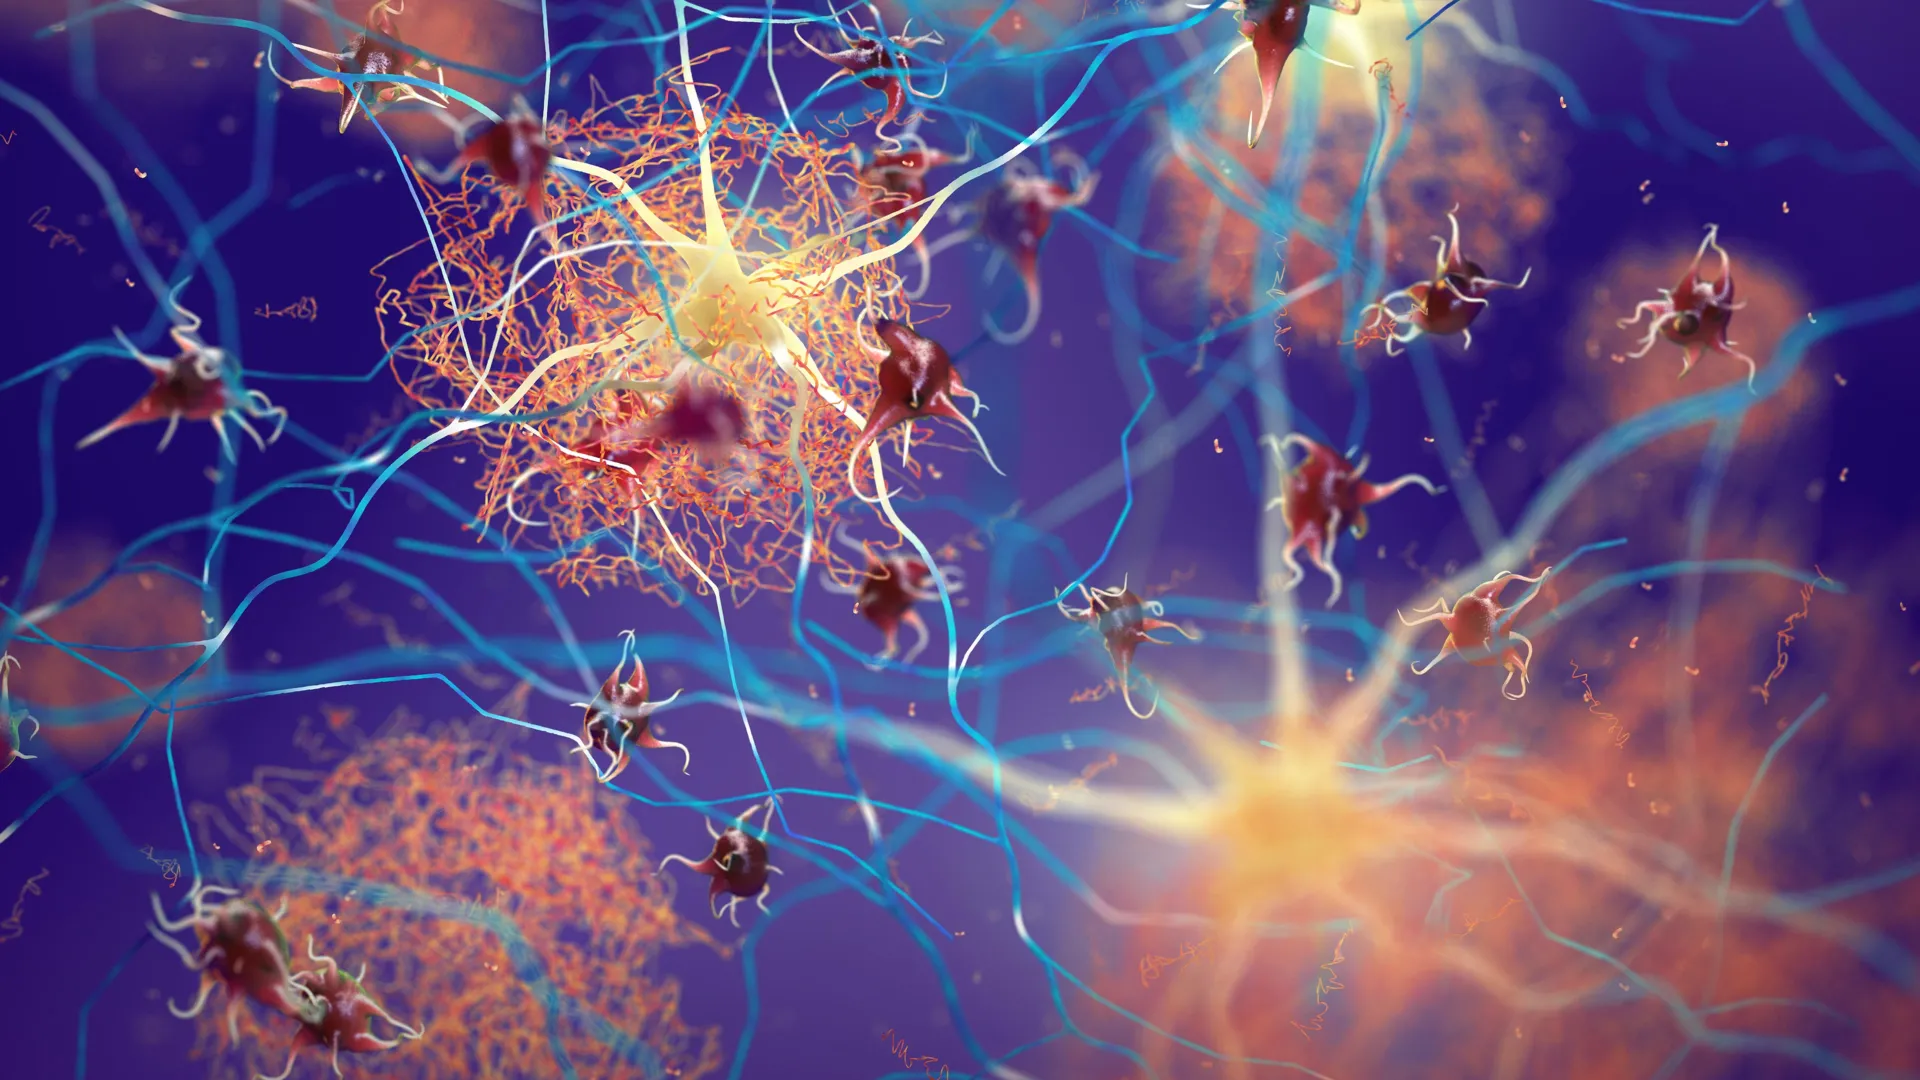
Scientists melt early protein clumps and shut down Alzheimer’s damage
November 15, 2025
Scientists melt early protein clumps and shut down Alzheimer’s damage
November 15, 2025
Kazakhstan 1-1 Belgium: Belgians miss chance to wrap up World Cup qualification
November 15, 2025
DPM directs to fast-track privatization process – RADIO PAKISTAN
November 15, 2025
Taylor Swift earns new title with historical milestone
November 15, 2025
Pope Leo welcomes cinema stars to the Vatican
November 15, 2025
Ongoing Fatigue Persists After Autoimmune Hepatitis Remission
November 15, 2025
A history of suicide attempts among individuals with schizophrenia is associated with tryptophan degradation via the salivary kynurenine pathway | BMC Psychiatry
November 15, 2025
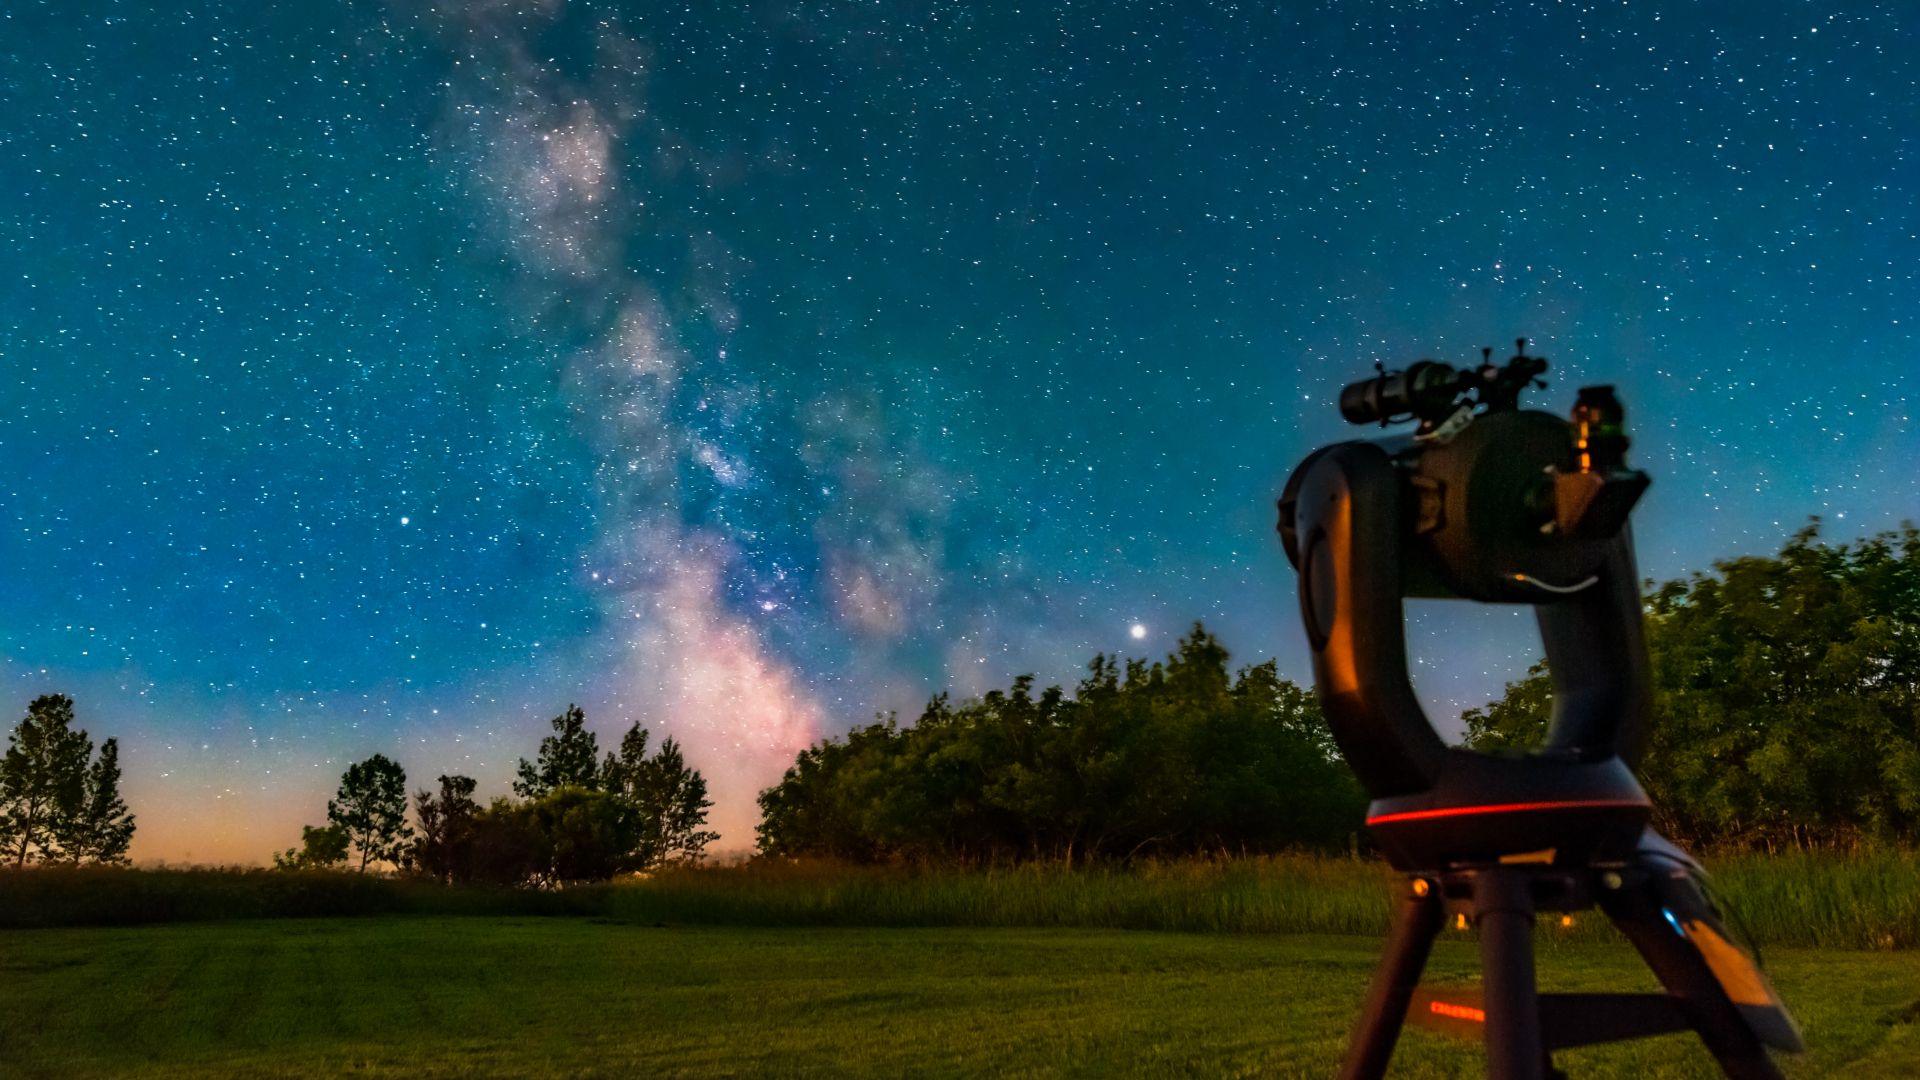
Expert advice for new stargazers: How to begin your amateur astronomy journey
November 15, 2025