Qaasid News
Download Our App
Latest News from Pakistan
Once Human Major Update On Jan 21 Introduces Enemy Fusion Mechanics
January 21, 2026
‘Basic needs unmet’ at Halifax care home put in special measures
January 21, 2026
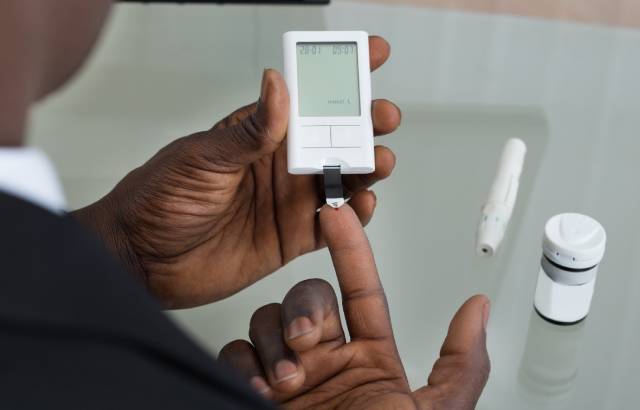
Protein Mapping in African Genomes: New Diabetes Insights
January 21, 2026
Greenland and the Arctic extension of 'Donroeism' – news.cgtn.com
January 21, 2026
Announcing the Next-Generation ASUS Chromebook CZ Series | ASUS Pressroom
January 21, 2026
Trump’s Air Force One turns back to Washington after ‘minor electrical issue’ | Donald Trump
January 21, 2026
‘Soviet attitudes framed local culture as backward’: the record label standing up to Russian imperialism | Music
January 21, 2026
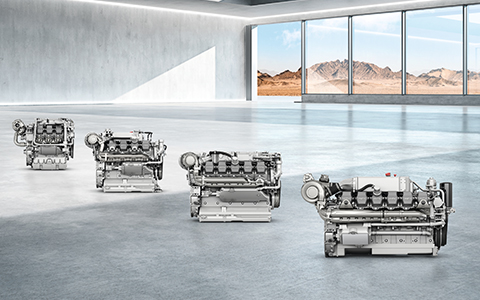
Rolls-Royce strengthens defence capabilities: 350 mtu engines for Boxer wheeled armoured vehicles
January 21, 2026
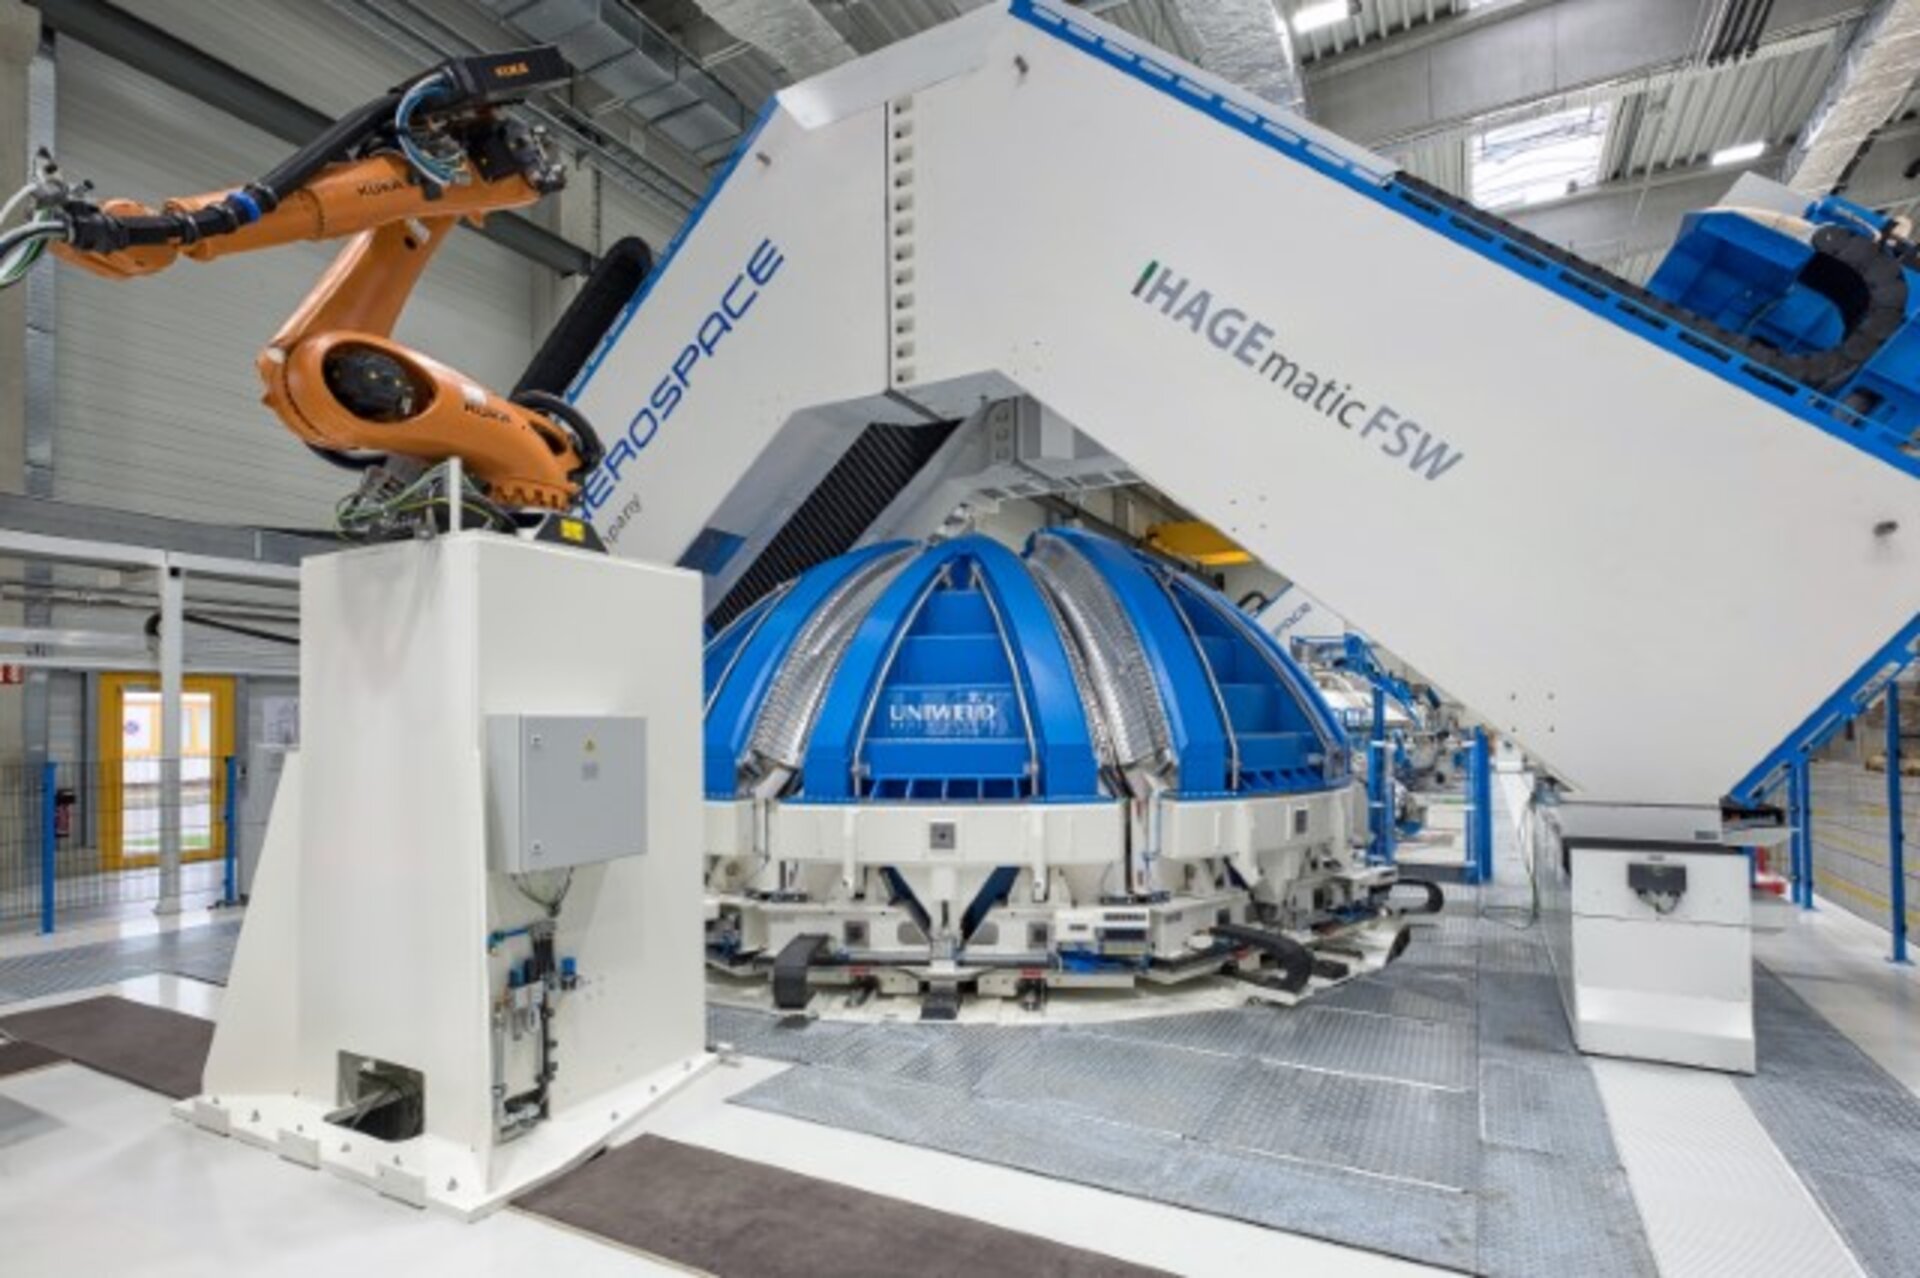
Artificial intelligence in manufacturing rocket parts
January 21, 2026
KSC Raises Urgent Alarm Over Escalating Hostilities and Grave Violations of Children’s Rights Across Syria – ReliefWeb
January 21, 2026