Qaasid News
Download Our App
Latest News from Pakistan
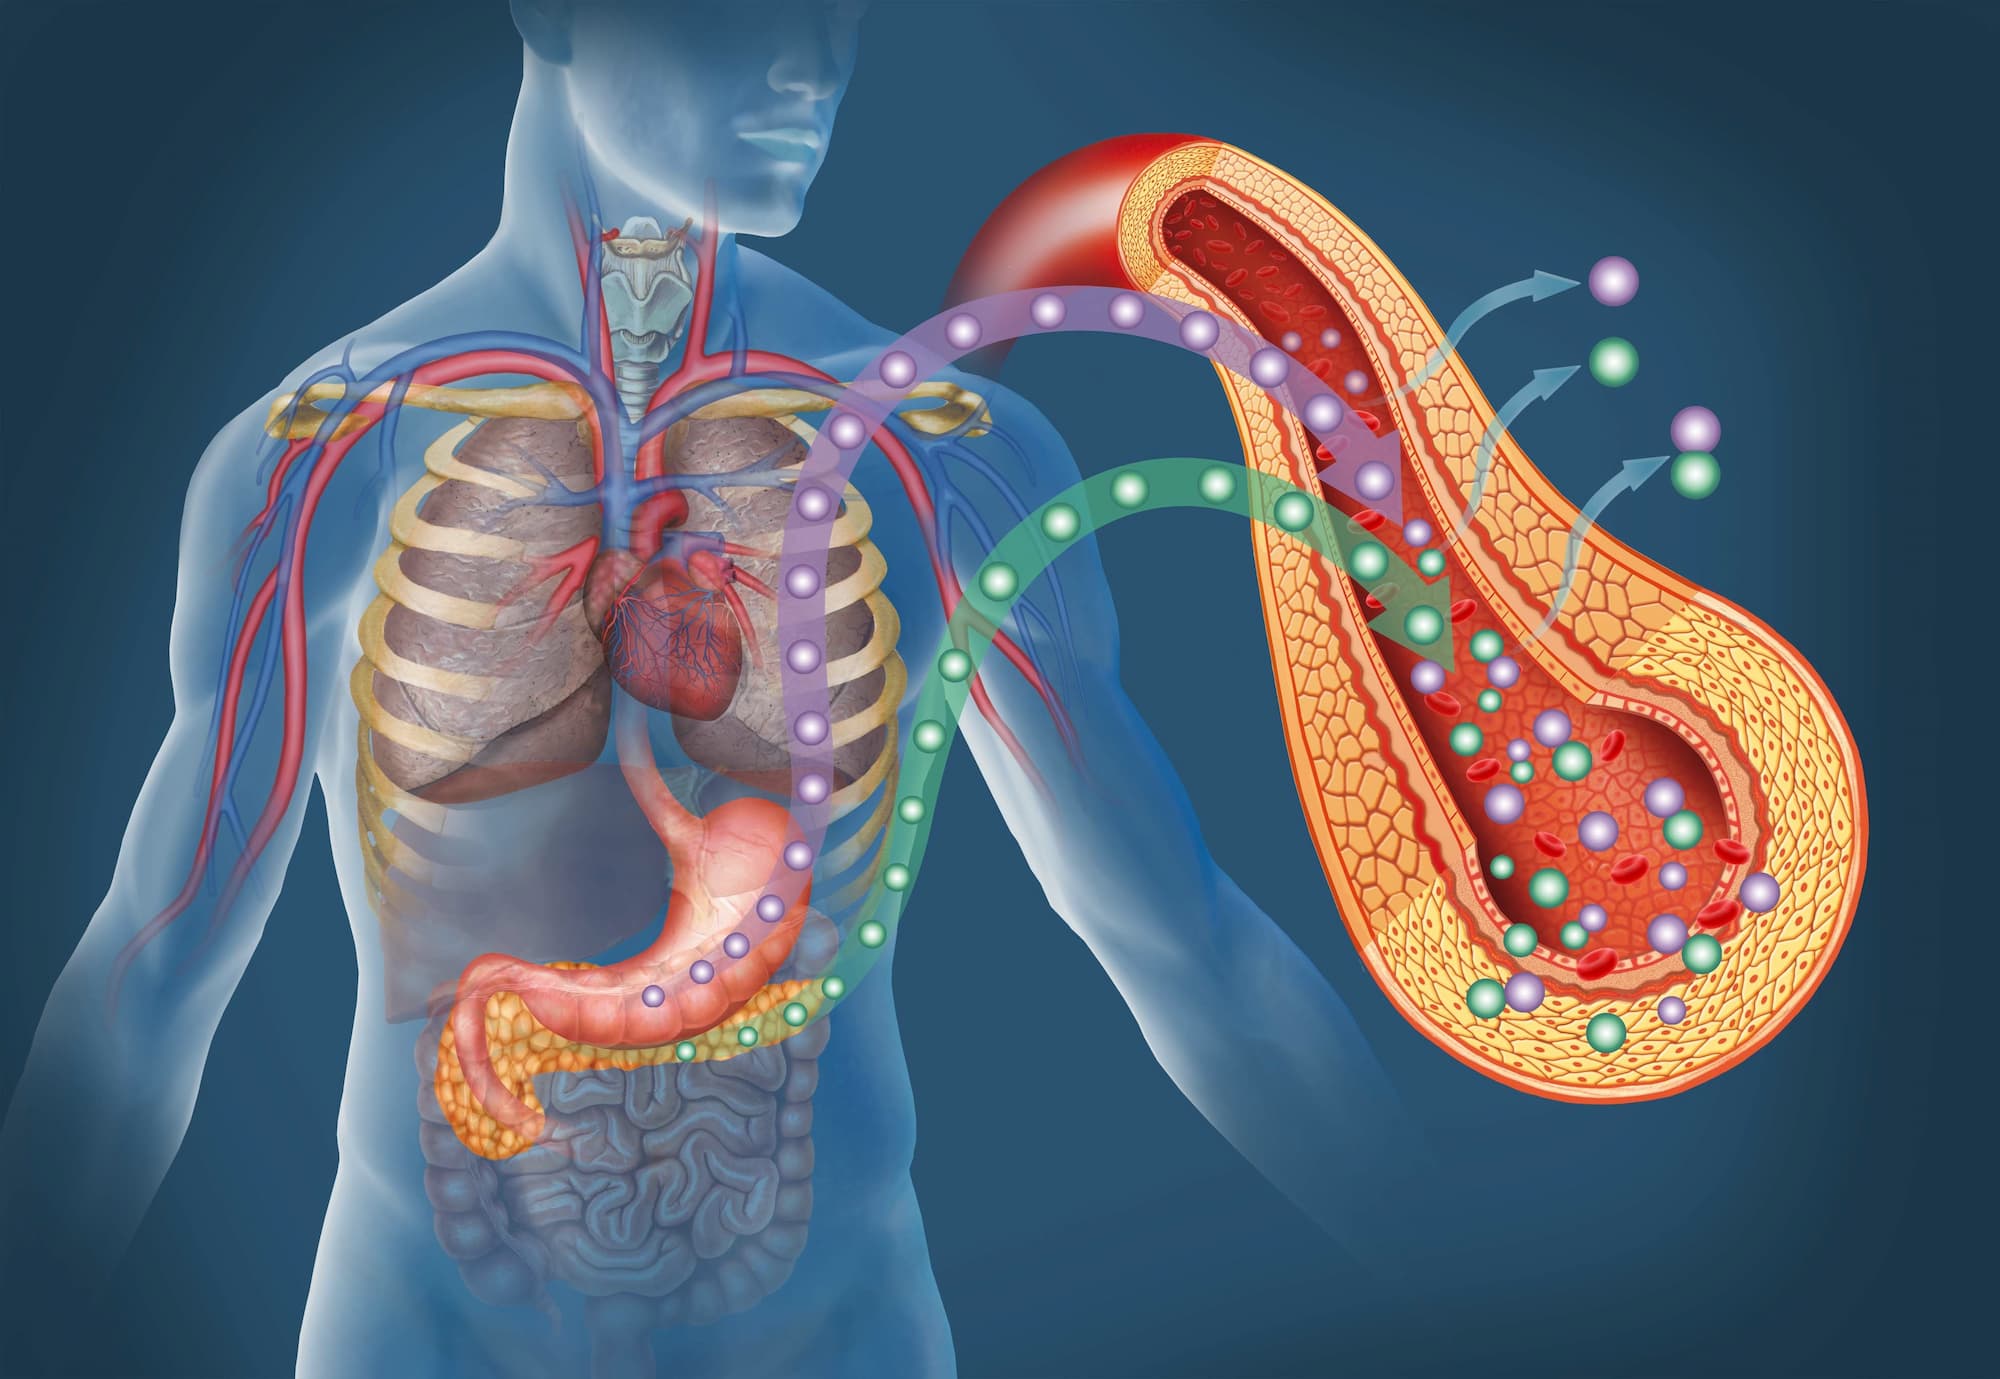
Incretin-Based Drugs May Reduce Risk of Dementia in Patients With Type 2 Diabetes
January 19, 2026
Pakistan-Saudi defence pact expansion to be decided jointly: defence minister
January 19, 2026
Jermelle Simon on How ‘The Upshaws’ Stopped Him Fearing His Sexuality
January 19, 2026
Imam sentenced for conducting child marriage in UK legal first | UK | News
January 19, 2026
Google Phone app gets short Material 3 Expressive bottom bar
January 19, 2026
Facebook-like cover photos are coming to WhatsApp
January 19, 2026
Gold and silver hit record highs as Greenland dispute spurs safe-haven buying – Reuters
January 19, 2026
How to watch legendary Hahnenkamm races at Kitzbühel
January 19, 2026
Italian fashion designer Valentino dies | World News
January 19, 2026
19 Vintage Photos of a Young Dolly Parton
January 19, 2026