Qaasid News
Download Our App
Latest News from Pakistan
Massive fire kills 6 in Karachi, destroys shopping centre – Reuters
January 18, 2026
These Stocks Will Collapse If the AI Bubble Pops in 2026
January 18, 2026
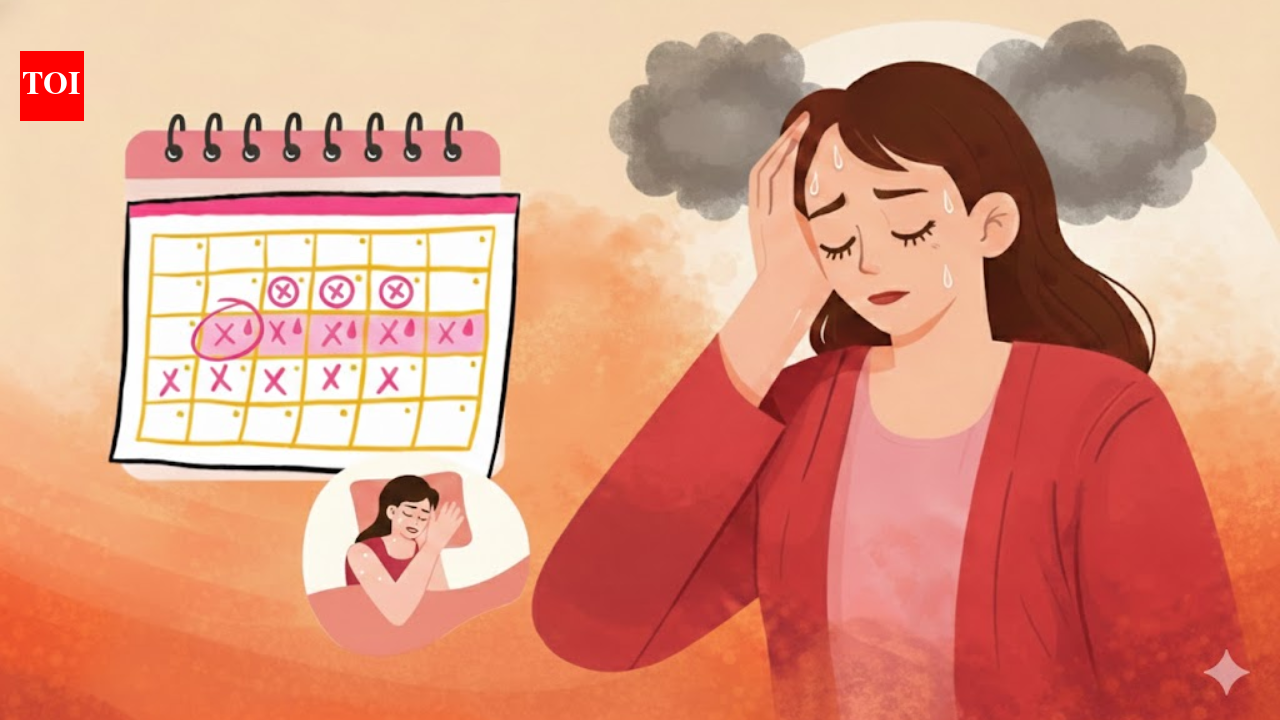
When menopause hits: How symptoms spill into work, home and relationships | India News
January 18, 2026
Brooklyn Beckham mingles with Hollywood stars without Nicola Peltz
January 18, 2026
Seahawks Fans Created ‘Unbelievable’ Atmosphere At Lumen Field In 41-6 Playoff Win Over 49ers
January 18, 2026
Jordan says King Abdullah received invitation to join Gaza peace board – Reuters
January 18, 2026
EU ambassadors summoned for emergency talks after Trump threatens tariffs over Greenland – Europe live | Greenland
January 18, 2026
Healthcare devices could generate 100 million tons of CO2 by 2050
January 18, 2026
Ernest Jones IV, Seahawks ‘Captain’ Leads Defensive Performance In Saturday’s Win
January 18, 2026
Sifting through remains in the ‘London lasagne’
January 18, 2026