Qaasid News
Download Our App
Latest News from Pakistan
Junaid Safdar’s wedding procession reaches Lahore venue – Life & Style
January 17, 2026
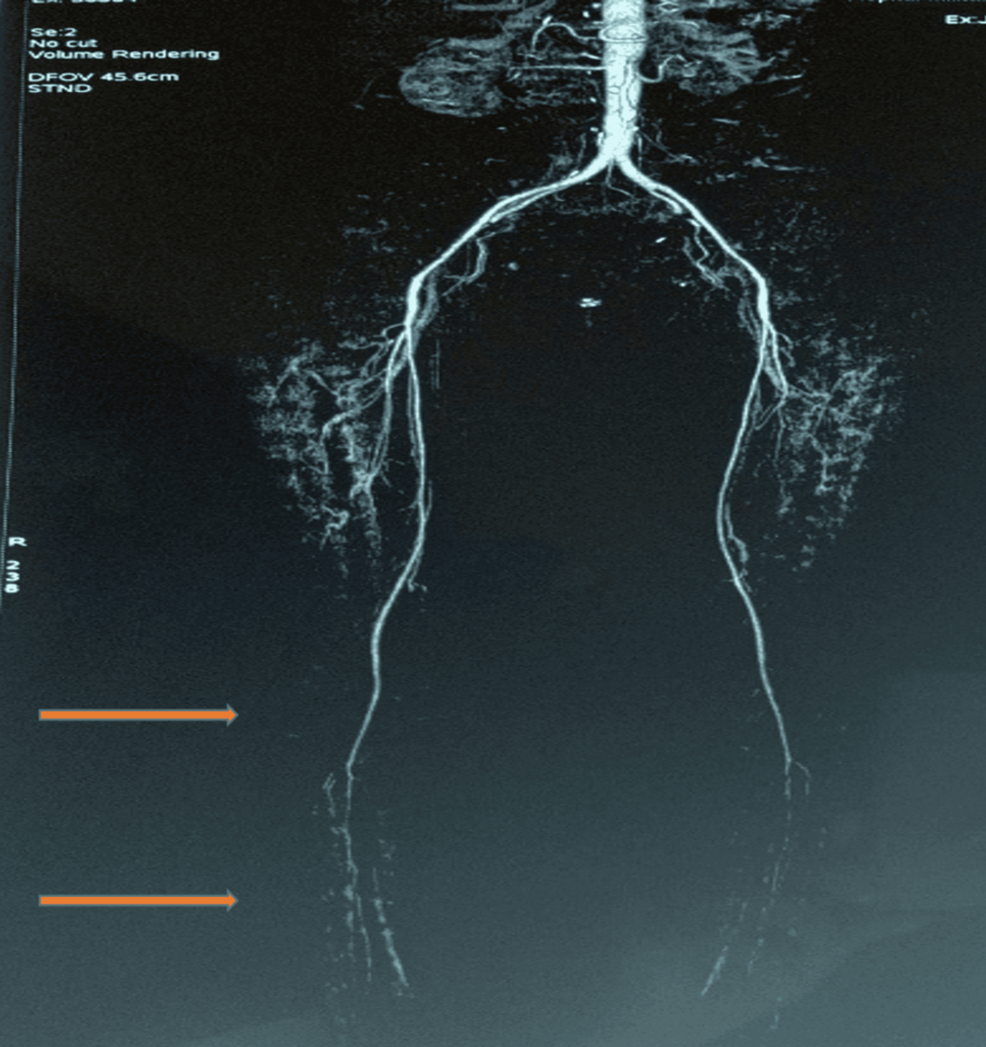
An Under-Recognized Manifestation of Systemic Sclerosis: Macrovascular Peripheral Arterial Disease
January 17, 2026
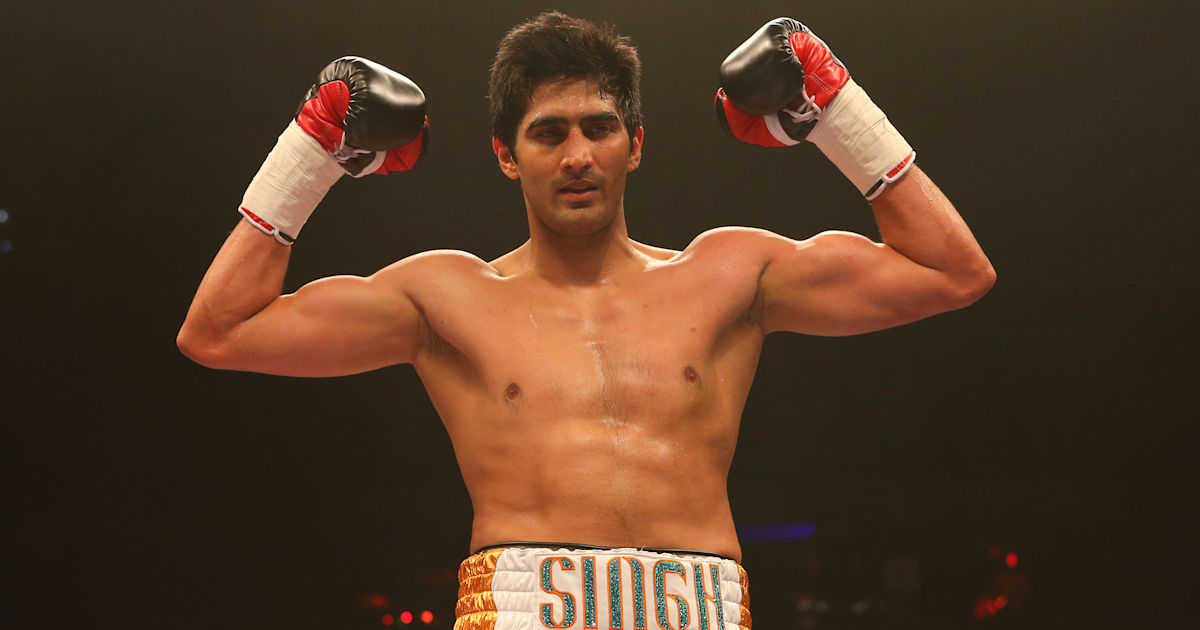
Vijender Singh appointed member of Asian Boxing Council
January 17, 2026
Scientists Make Stunning Find Inside Prehistoric Wolf’s Stomach
January 17, 2026
Connor Storrie Is Everywhere—And So Are His Killer IWC Watches
January 17, 2026
Diplomacy or a Dangerous Reckoning
January 17, 2026
Warren Buffett on parenting, horse betting and why he stopped talking politics
January 17, 2026
Umit Benan Men’s Fall 2026 Ready-to-Wear Runway, Fashion Show & Collection Review
January 17, 2026
Social media posts case: Non-bailable arrest warrants for Imaan, Hadi reissued – Dawn
January 17, 2026
Social media posts case: Non-bailable arrest warrants for Imaan, Hadi reissued – Dawn
January 17, 2026