Qaasid News
Download Our App
Latest News from Pakistan
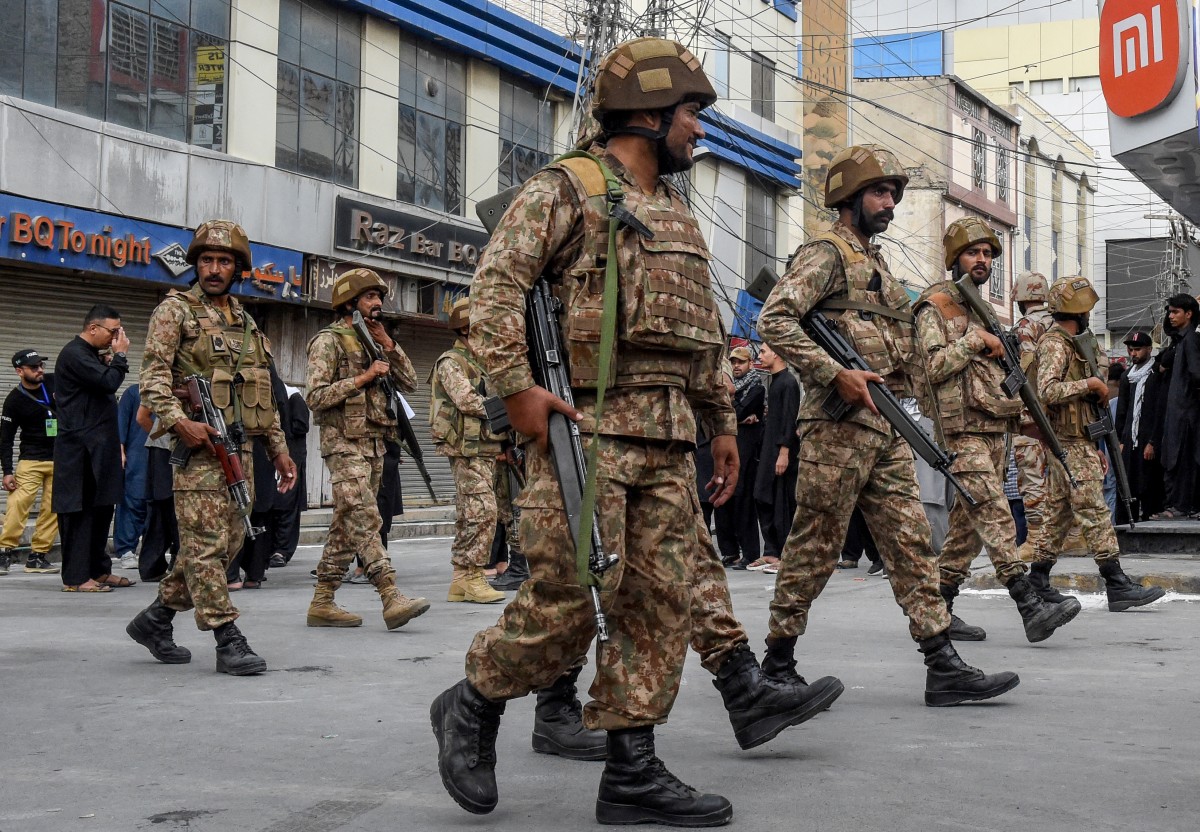
Why Pakistan Could Pay The “Highest Price” of U.S. Military Operations on Tehran?
January 17, 2026
The One-of-a-Kind Mercedes G 600 TE AMG
January 17, 2026
Paralympic legend Brian McKeever answers your biggest questions
January 17, 2026
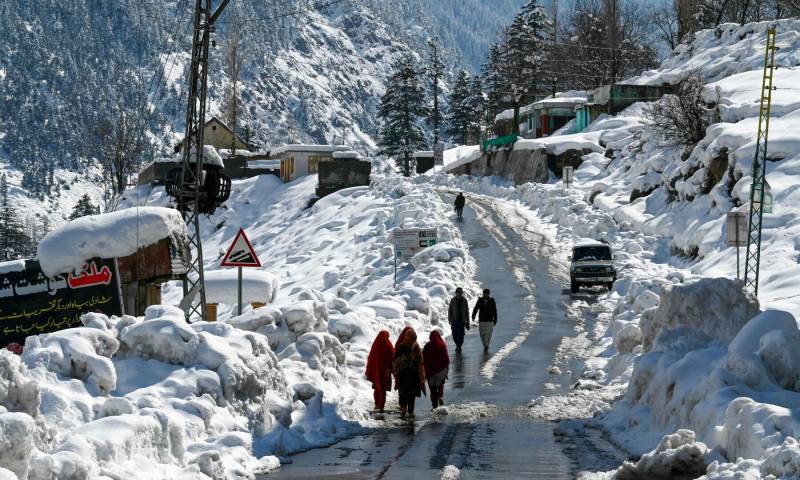
Snowfall continues in KP, Gilgit-Baltistan as cold wave intensifies
January 17, 2026
Selva Prabhu clears Asian Games 2026 qualifying mark in triple jump
January 17, 2026
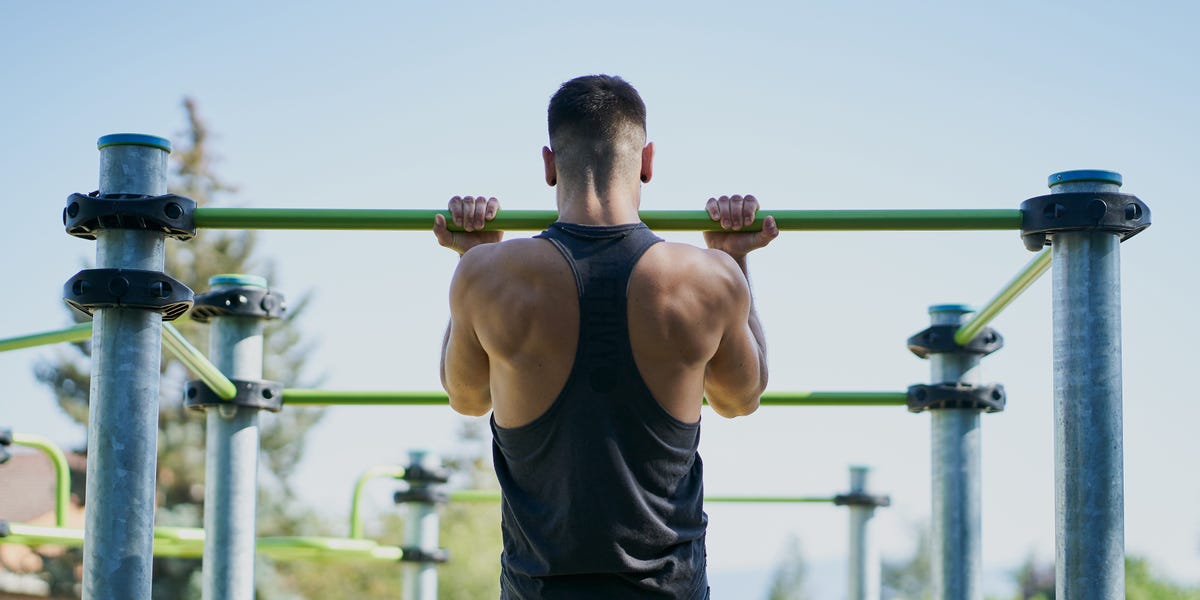
How to Lose Fat, Hold on to Muscle: Personal Trainers of Celebs, Execs
January 17, 2026
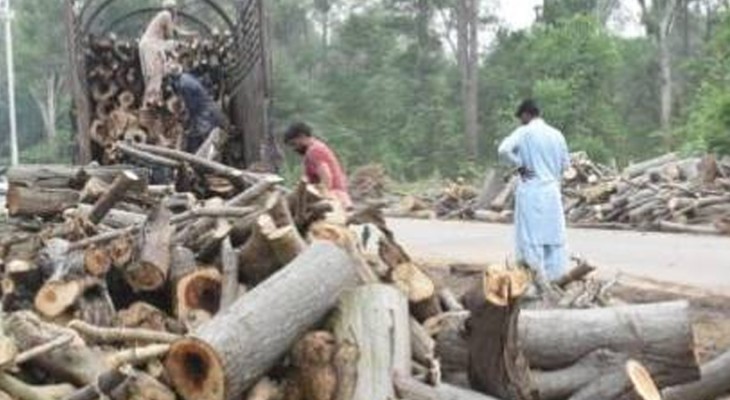
Don’t cut trees until February 2, IHC tells CDA-INP
January 17, 2026
Greenland and Denmark set for anti-Trump protests – Europe live | Europe
January 17, 2026
Early Bifidobacteria Colonisation Reduces Childhood Allergy Risk
January 17, 2026
Shelling out? Easter eggs in the UK are smaller but pricier this year | Food & drink industry
January 17, 2026