Qaasid News
Download Our App
Latest News from Pakistan
Deep Learning Model Developed to Help Predict Functional Impact of Regulatory Mutations – Genetic Engineering and Biotechnology News
February 5, 2026
LACMA unveils opening date for new David Geffen Galleries
February 5, 2026
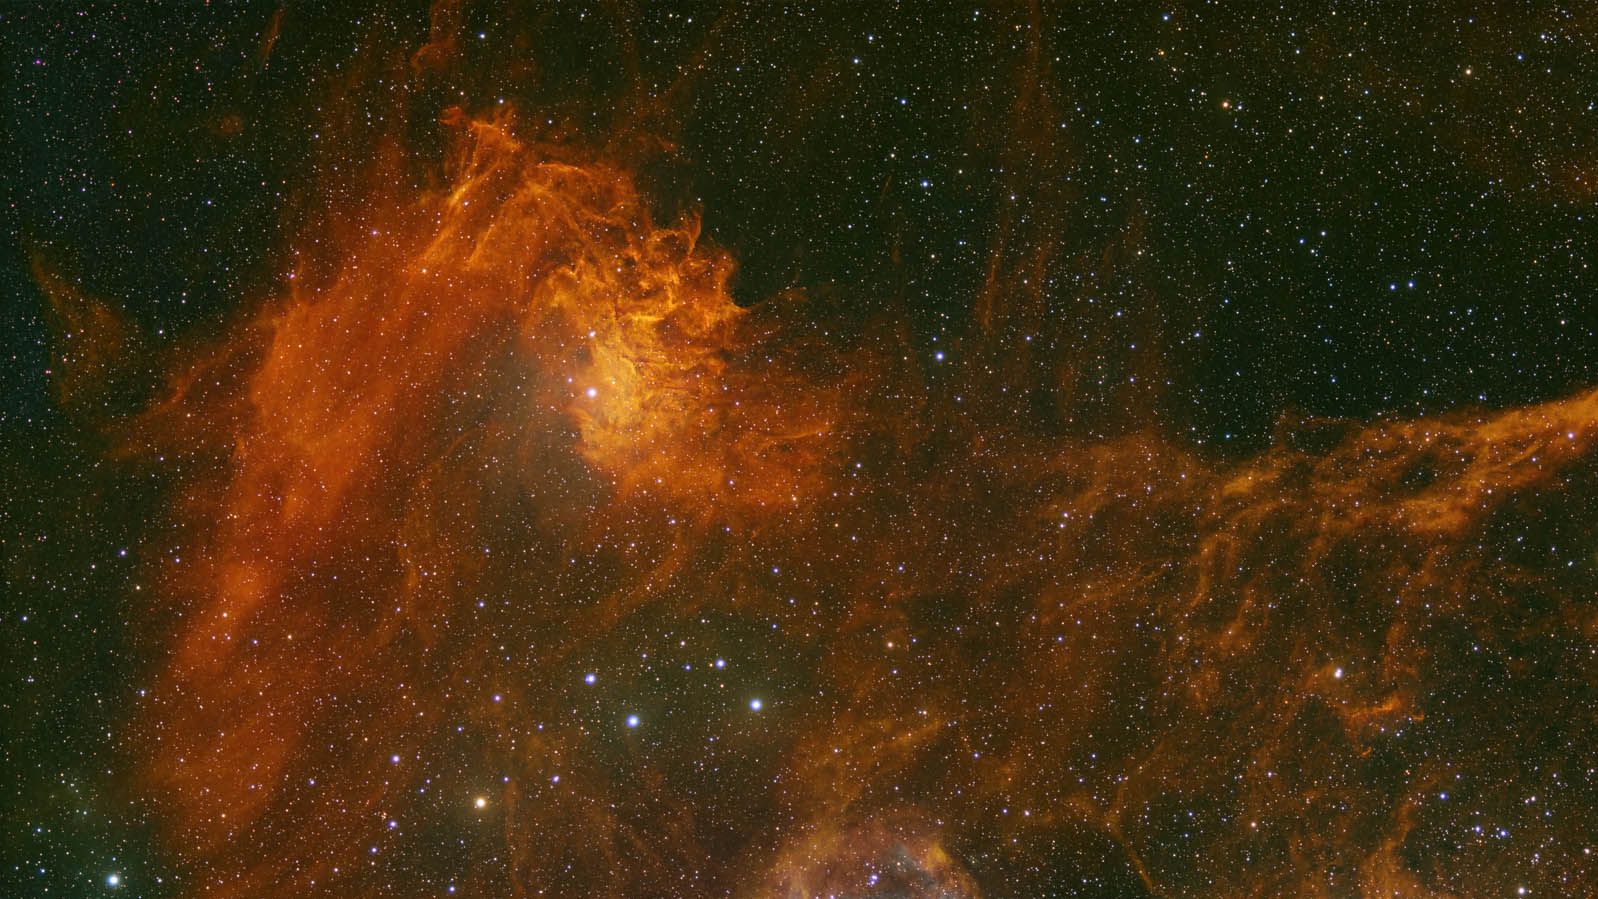
Astrophotographer captures the ‘Flaming Star Nebula’ ablaze in deep-space (photo)
February 5, 2026
Sixers reportedly trade veteran Eric Gordon to Grizzlies
February 5, 2026
Emerald Fennell hopes Wuthering Heights will ‘provoke a primal response’ | Wuthering Heights
February 5, 2026
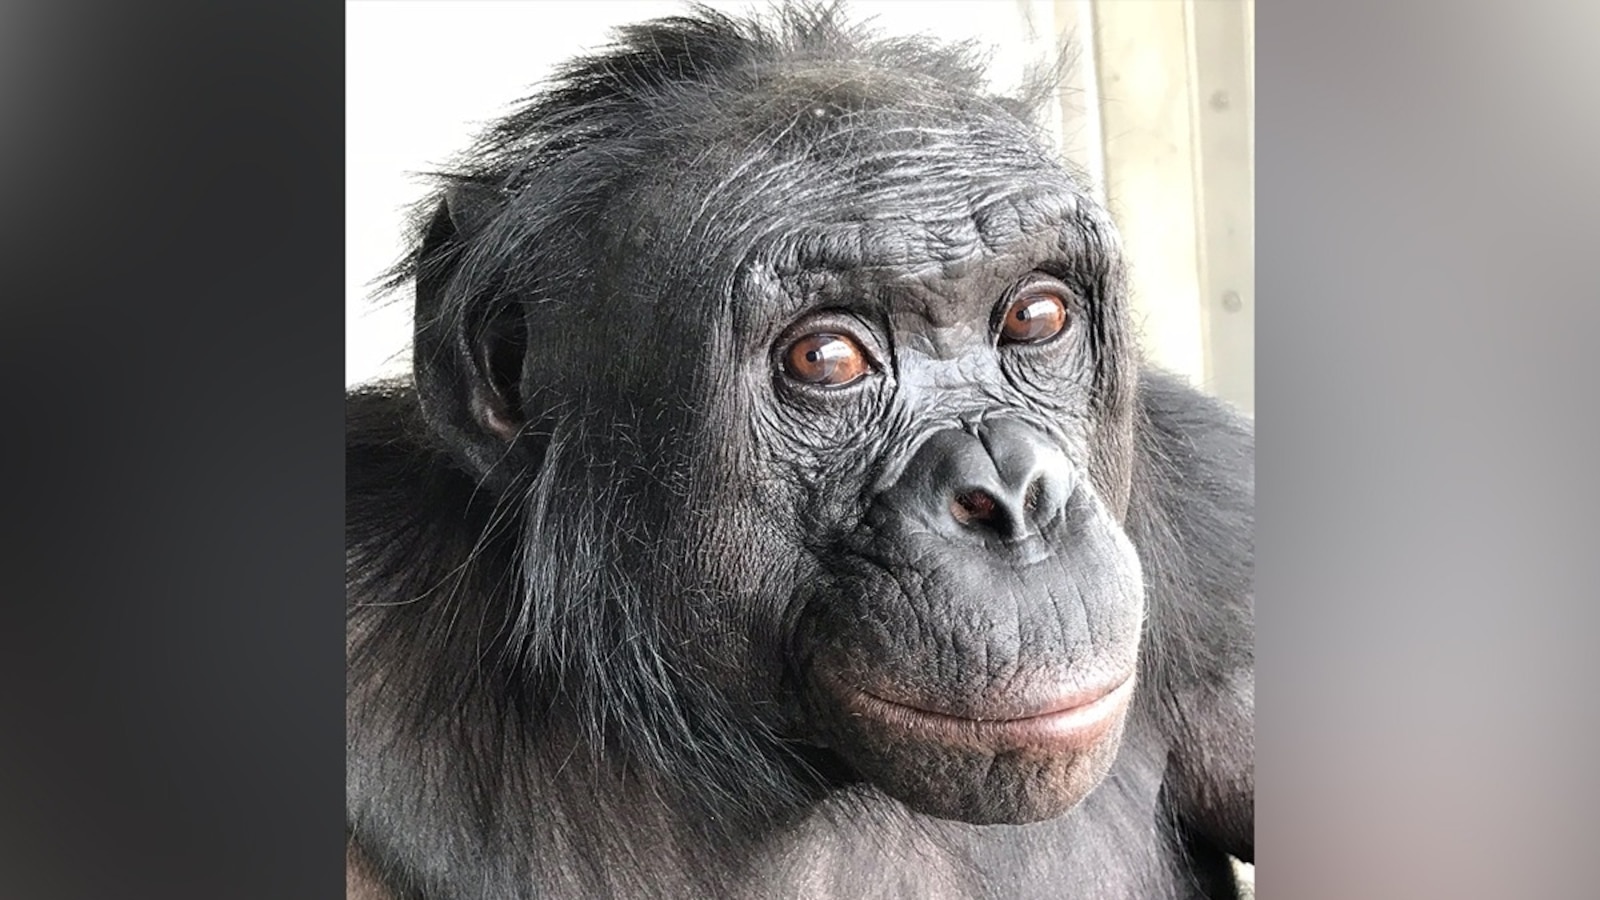
Can apes play pretend? Scientists use an imaginary tea party to find out
February 5, 2026
Iran is betting that Trump does not have a plan for regime change | Iran
February 5, 2026
ANTIGUA AND BARBUDA CULINARY MONTH RETURNS WITH EXCITING LINEUP OF EVENTS THROUGHOUT MAY 2026
February 5, 2026
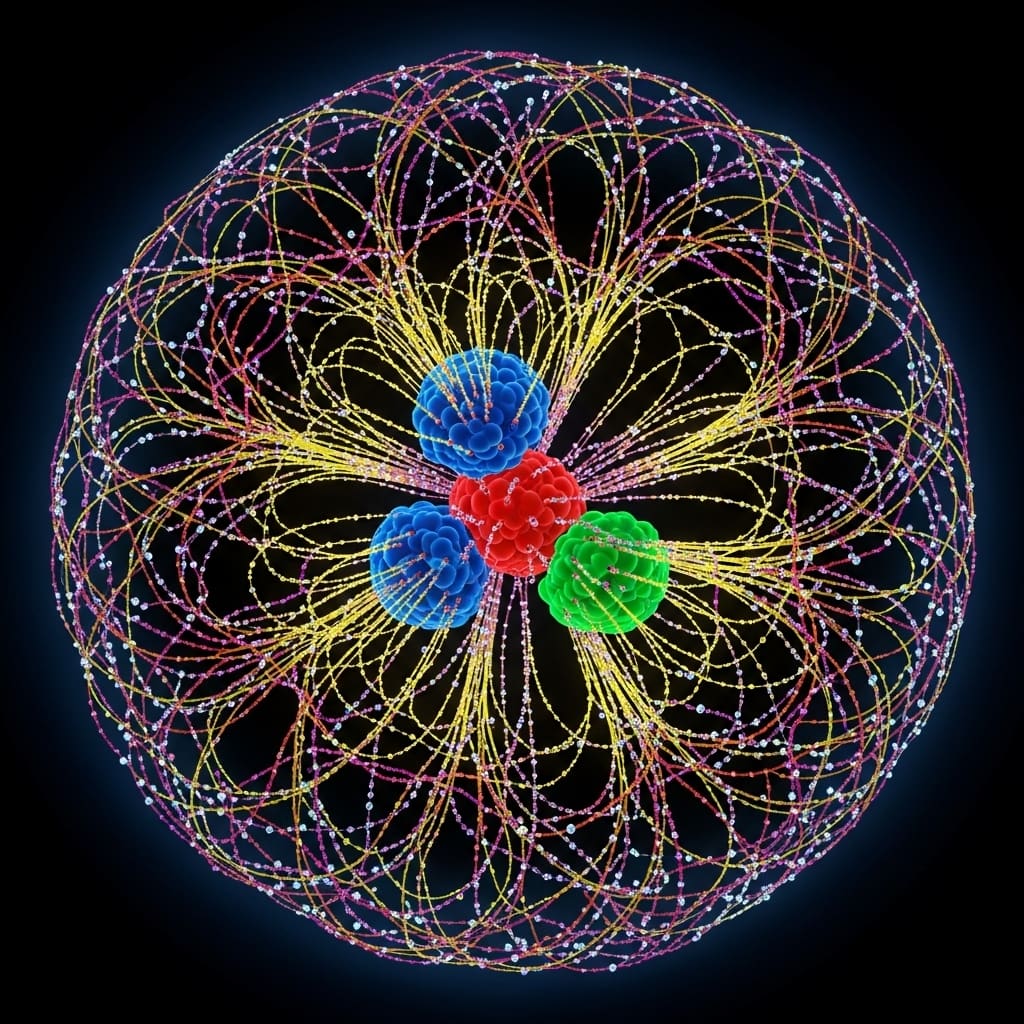
Simplified Physics Model Unlocks Secrets Of How Matter Binds Inside Neutrons
February 5, 2026
Enlicitide Meaningfully Lowers LDL-C at 24 Weeks in Patients At Risk for ASCVD Events
February 5, 2026