Qaasid News
Download Our App
Latest News from Pakistan
Press Release – Book Launch “Defense and Diplomacy: A Compilation of Selected Articles by S.M Hali”
January 15, 2026
ECNEC approves development projects worth over Rs117bn – RADIO PAKISTAN
January 15, 2026
Pakistan says it backs Gaza peace plan, hopes next phase leads to Palestinian state – Arab News
January 15, 2026
Former PlayMaker finds success in acting, advocacy
January 15, 2026
President vows to cement economic ties with Bahrain – RADIO PAKISTAN
January 15, 2026
GREEDFALL: THE DYING WORLD : DISCOVER THE SECRETS BEHIND THE CREATION OF YECHT FRADÍ, THE FICTIONAL LANGUAGE OF THE NATIVE PEOPLE OF TEER FRADEE
January 15, 2026
Greenland’s defence is ‘common concern’ for Nato, Danish PM says as European troops fly in | Greenland
January 15, 2026
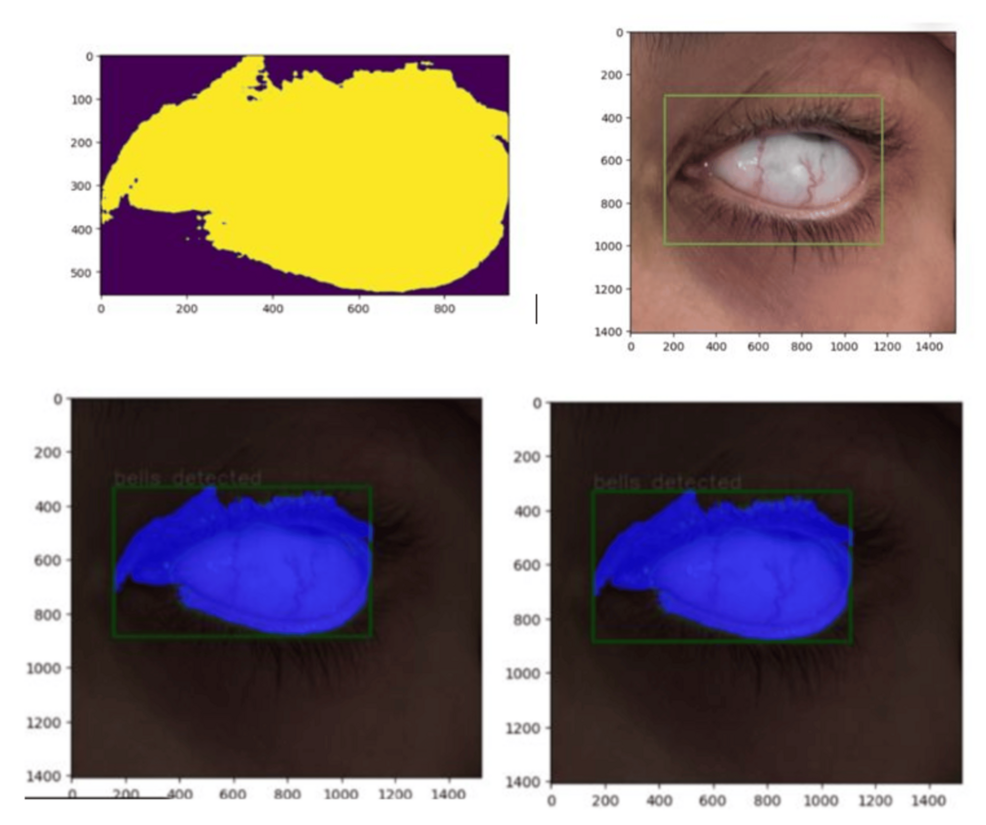
Developing an AI-Based Model for Lagophthalmos and Bell’s Phenomenon Detection in Intensive Care Unit Patients: A Gold Standard Comparison
January 15, 2026
Punjab prisons department transfers Adiala Jail superintendent
January 15, 2026
PM lauds China's generous support to Pakistan – RADIO PAKISTAN
January 15, 2026