Qaasid News
Download Our App
Latest News from Pakistan
English language requirements for immigration applications
January 13, 2026
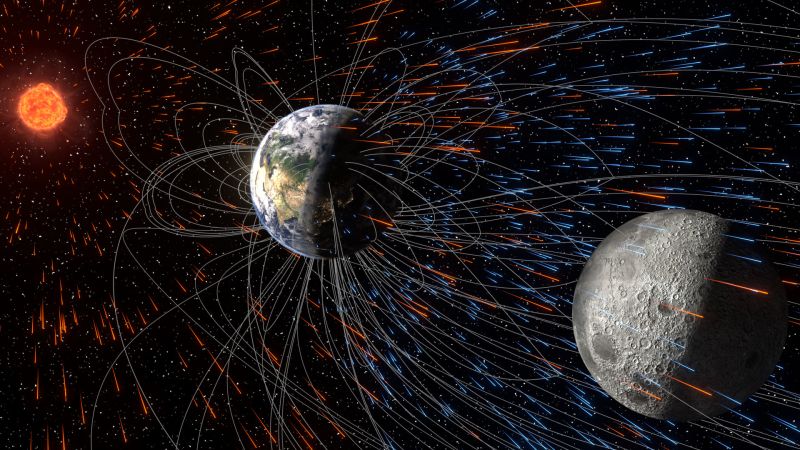
The moon has been stealing Earth’s atmosphere for billions of years
January 13, 2026
Mountain Hawks Seek Third Straight Win At Boston U. Wednesday
January 13, 2026
Trump promises ‘help is on its way’ and tells Iranians to ‘keep protesting’ | Iran
January 13, 2026
Terrorist Designations of Muslim Brotherhood Chapters – U.S. Department of State (.gov)
January 13, 2026
Iran: ‘The killing of peaceful demonstrators must stop,’ UN rights chief says – UN News
January 13, 2026
Poor weather grounds flights, forces diversions at major airports
January 13, 2026
Iran in Crisis: Time for a Change from Within – International Crisis Group
January 13, 2026
Free Movement Weekly Immigration Newsletter #102
January 13, 2026
Unsafe mercury levels found in two face creams in Luton shops
January 13, 2026