Qaasid News
Download Our App
Latest News from Pakistan
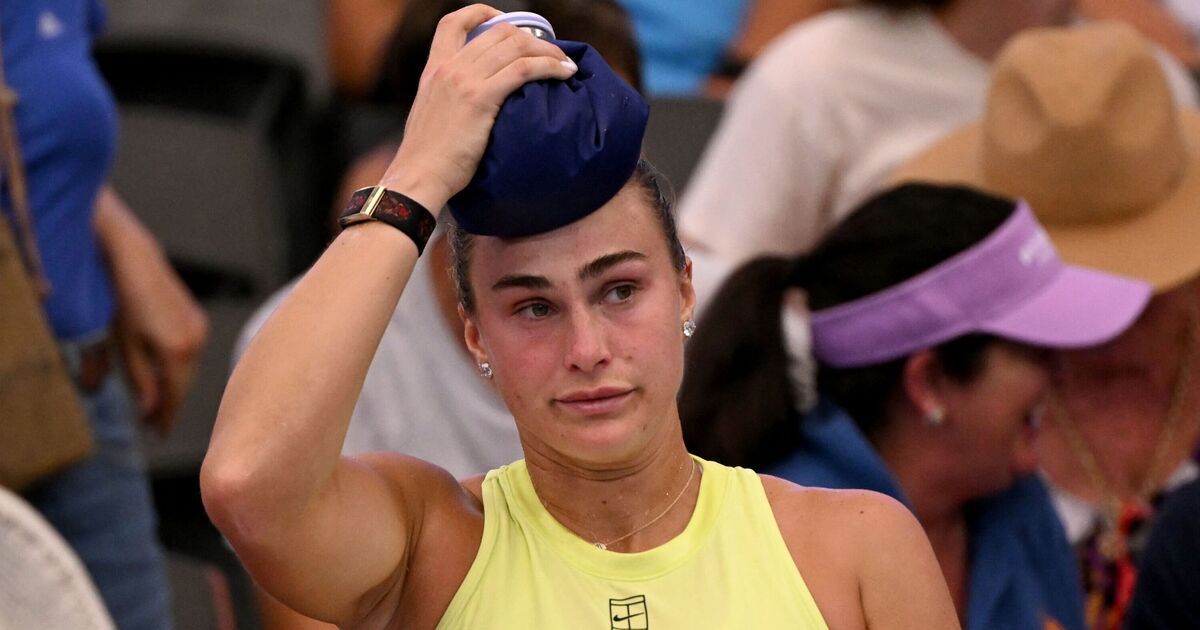
Aryna Sabalenka breaks silence after opponent refused handshake | Tennis | Sport
January 12, 2026
Vets invited to complete equine quality of life survey
January 12, 2026
The State of the Oscar Race, According to the 2026 Golden Globes
January 12, 2026
What is below Earth, since space is present in every direction?
January 12, 2026
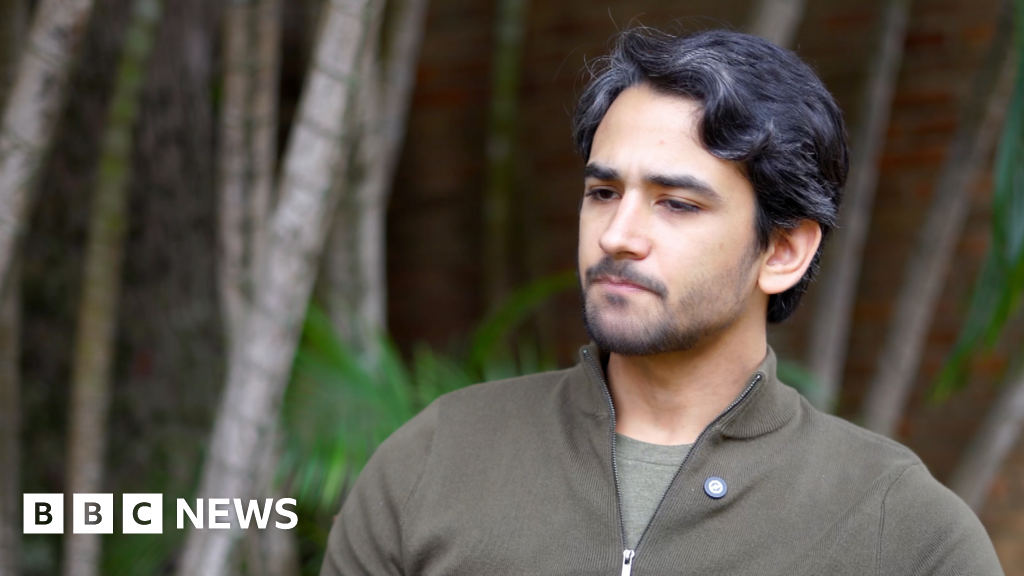
Jailed Venezuelan politician’s son criticises slow prisoner release
January 12, 2026
Plant seeds inspire new generation of morphing aircraft wings
January 12, 2026
School-based HPV vaccination protects even unvaccinated women
January 12, 2026
Spain seizes 10 tonnes of cocaine in largest-ever maritime bust
January 12, 2026
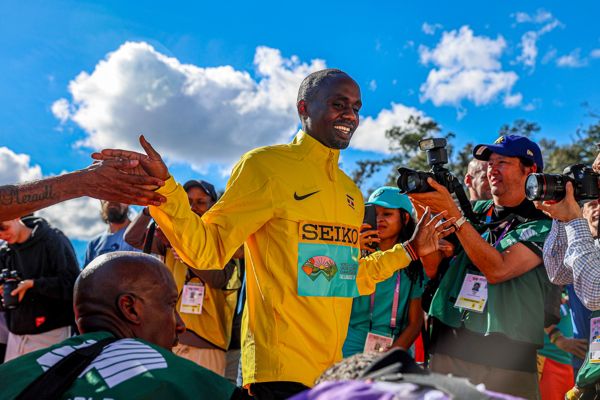
The Kiplimo-Cheptegei effect: how Uganda has redrawn the cross-country map | News | Tallahassee 26
January 12, 2026
Improving Adherence to Electronic Patient-Reported Outcomes:A Null-res
January 12, 2026