Our study provides novel insights into the relationship between the IBI and the risk of 30-day readmission following elective PCI. By leveraging a comprehensive retrospective cohort, we have demonstrated that higher IBI values are significantly correlated with an increased risk of readmission, independent of traditional risk factors. This correlation was particularly pronounced in older, male patients and those with diabetes, highlighting the potential utility of IBI in risk stratification for these vulnerable populations. Our multivariate analysis revealed that a one-unit increase in IBI is associated with a 41% increase in the risk of 30-day readmission (OR 1.41, 95% CI 1.19–1.67, p < 0.001). This means that for every unit increase in IBI, the likelihood of a patient being readmitted within 30 days increases significantly. For example, a patient with an IBI of 2 compared to a patient with an IBI of 1 would have a 41% higher risk of readmission. This increased risk is likely due to the role of inflammation in promoting plaque instability, thrombus formation, and other adverse cardiovascular events that can lead to hospital readmission.
When compared to other studies, our findings are consistent with those of Li et al. [9], who demonstrated the association between inflammatory markers and the risk of hospitalization for heart failure post-myocardial infarction. However, our study extends these insights by showing that an integrated inflammatory index, rather than a single biomarker, is associated with readmission, emphasizing the complexity of inflammatory processes in cardiovascular disease [10]. The association between inflammation and cardiovascular outcomes, including post-PCI readmission, is well-established in the literature [11, 12]. Our findings are consistent with those of recent studies that have implicated inflammation in the pathogenesis of adverse cardiovascular events [13]. For instance, a study by Xie et al. [14] confirmed the predictive value of C-reactive protein, a key component of IBI, for cardiovascular events. Our study extends these insights by showing that an integrated inflammatory index, rather than a single biomarker, is associated with readmission, emphasizing the complexity of inflammatory processes in cardiovascular disease.
The potential mechanisms underlying the association between IBI and readmission are multifaceted. Inflammation is known to play a role in plaque rupture and thrombus formation, which can lead to acute coronary syndromes and potentially readmission [15]. Also, local or systemic inflammation has been proven to be a possible mechanism underlying the development of coronary slow flow phenomenon [16, 17]. Many patients experience recurrent episodes of angina due to the coronary slow flow phenomenon, leading to frequent hospitalizations [18]. Furthermore, inflammation may also contribute to the development of heart failure, a common cause of readmission following PCI [19]. By integrating multiple inflammatory biomarkers, IBI may provide a more comprehensive assessment of the inflammatory state and its impact on post-PCI outcomes.
The stronger correlation observed in older patients and those with diabetes may reflect the heightened inflammatory state often observed in these patient groups [20, 21]. Diabetes is known to induce a chronic low-grade inflammatory state, which could potentiate the association between IBI and readmission [22]. Similarly, aging is associated with an increased inflammatory burden, which may contribute to the observed association [23]. These findings underscore the importance of considering IBI in the context of patient-specific risk factors when assessing the risk of readmission. The stronger correlation observed in males may reflect sex-specific differences in inflammatory responses to PCI [24]. Emerging evidence suggests that sex hormones modulate inflammation, with males exhibiting higher levels of certain inflammatory markers compared to females [25]. This could potentially explain the enhanced association between IBI and readmission in male patients. Additionally, the higher IBI in males may also be indicative of a more aggressive inflammatory process post-PCI, which could lead to a higher likelihood of complications and subsequent readmission [26].
IL−6 is a well-established inflammatory marker that has been extensively studied in the context of cardiovascular disease. Recent studies have shown that elevated IL−6 levels are associated with increased risk of adverse outcomes following PCI. For instance, high levels of IL−6 have been linked to larger infarct sizes and higher mortality rates in patients with ST-segment elevation myocardial infarction [27]. Additionally, IL−6 has been identified as an independent predictor of non-target lesion progression in patients after coronary stenting [28]. In our study, we collected data on IL−6 levels to provide additional supporting evidence for the effectiveness of IBI. The significant difference in IL−6 levels between the readmitted and non-readmitted groups aligns with the observed trends in IBI, further validating its role as a comprehensive measure of inflammation. The inclusion of IL−6 in our data collection was intended to demonstrate that it shares a similar trend with IBI, thereby reinforcing the validity of IBI as a predictor of readmission risk.
The implications of our findings for clinical practice are significant. By identifying patients with higher IBI values as being at increased risk of readmission, clinicians may be able to target these individuals for more intensive post-discharge monitoring and intervention. This could potentially lead to a reduction in readmission rates and associated healthcare costs, as well as improved patient outcomes.
It is important to note that our study is not without limitations. As a retrospective cohort study, it is subject to the inherent biases and limitations of such designs. First, Our study is limited by the lack of standardized adjudication of readmission urgency or etiology, which precluded stratification into urgent vs. non-urgent or cardiac vs. non-cardiac categories. Future prospective studies with dedicated adjudication committees are needed to validate these findings in such contexts. Secondly, Second, geographical factors and variations in healthcare practices, as well as disparities in the availability and utilization of primary care, can significantly influence readmission rates. Our study population is drawn from a specific region, which may not be representative of other areas with different healthcare systems, patient demographics, or clinical practices. For instance, regions with limited access to primary care or specialized cardiovascular services may experience higher readmission rates due to inadequate post-discharge follow-up and management. Notably, we excluded patients who experienced major procedural complications, which were defined as complications necessitating additional interventions or treatments beyond standard PCI, such as vascular perforation, acute stent thrombosis, or significant bleeding requiring transfusion. While this exclusion was intended to focus on the elective PCI population and minimize confounding from procedures that became emergent, it may introduce selection bias. Future prospective studies are needed to validate our findings and to explore the potential of IBI as a predictive tool in a broader range of patient populations and clinical settings.
Few names carry as much weight in gym culture as Joe Weider’s. Long before lifting became the norm, Weider was lifting barbells made from scrap metal. The man behind the Mr Olympia bodybuilding competitions built the stage for stars such as a…
AirPods are one of those items we all flock to during major sales events. Prime Day, Memorial Day, Black Friday, we want to see AirPods reduced. They’re arguably one of the most popular earbuds on…
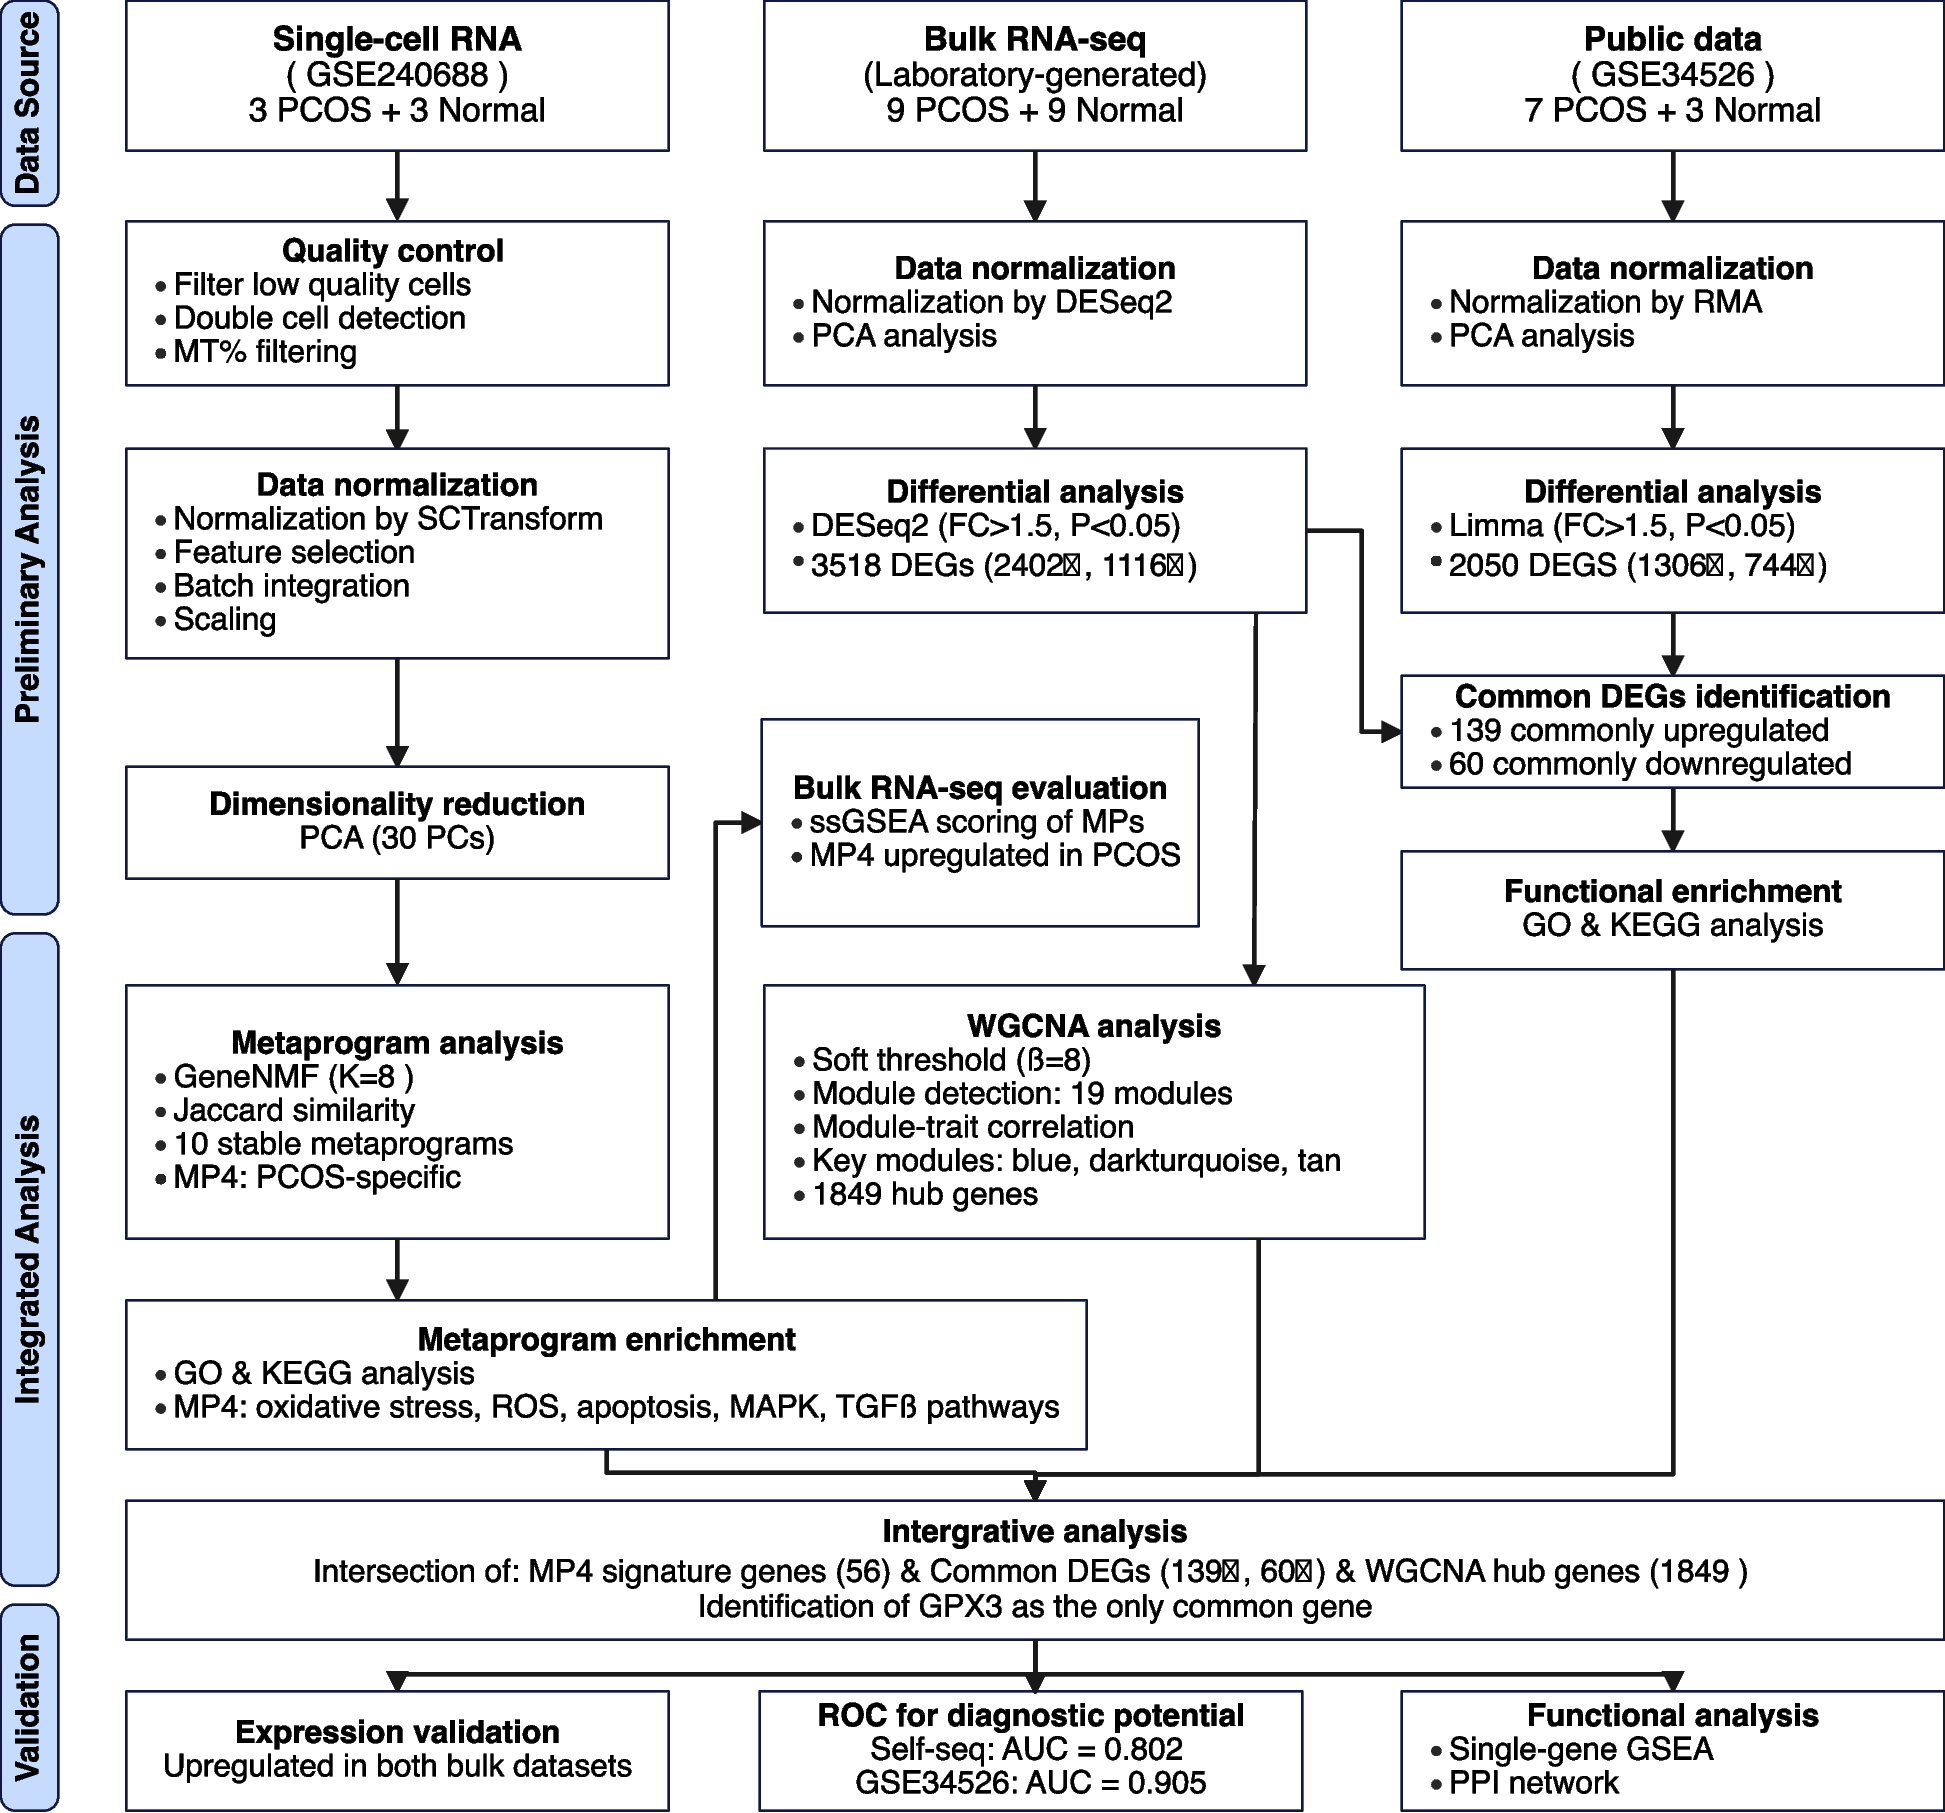
Figure 1 depicts our analytical workflow integrating three datasets: single-cell RNA-seq (GSE240688), bulk RNA-seq from our laboratory cohort, and a validation dataset (GSE34526). This integrative transcriptomic approach combines non-negative matrix factorization, differential expression analysis, and co-expression network analysis to bridge single-cell and bulk transcriptomic findings, ultimately identifying key regulatory genes in PCOS pathophysiology.
Fig. 1
Flowchart of the Study Design and Analytical Workflow
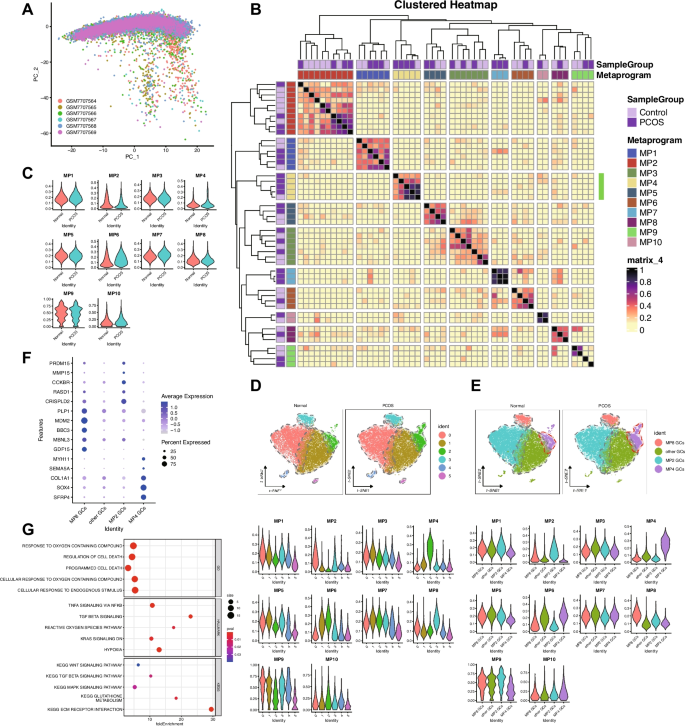
Metaprogram analysis reveals molecular signatures and cellular heterogeneity in PCOS granulosa cells
NMF was applied to deconvolve transcriptional programs in single-cell datasets, yielding 10 stable metaprograms (MPs, Fig. 2). To establish the optimal factorization dimensionality, we systematically scanned k values from 5 to 20, guided by quantitative evaluation of intra-sample cluster separation using silhouette coefficient analysis to ensure robust program delineation. The selected k = 8 demonstrated balanced performance, achieving both high-resolution separation of transcriptional programs within individual samples and preservation of biologically interpretable modules. This parameterization generated 48 sample-specific expression programs (8 per sample across six specimens), which were aggregated into 10 consensus metaprograms via cosine similarity-based hierarchical clustering. The resultant block-diagonal similarity matrix structure revealed conserved transcriptional modules exhibiting cross-sample reproducibility. Metaprogram refinement employed stringent dual criteria: genes recurrently detected in sample-level programs (confidence ≥ 0.5) and accounting for ≥ 80% of cumulative loading variance (weight threshold = 0.8), ensuring both technical robustness and biological coherence.
Fig. 2
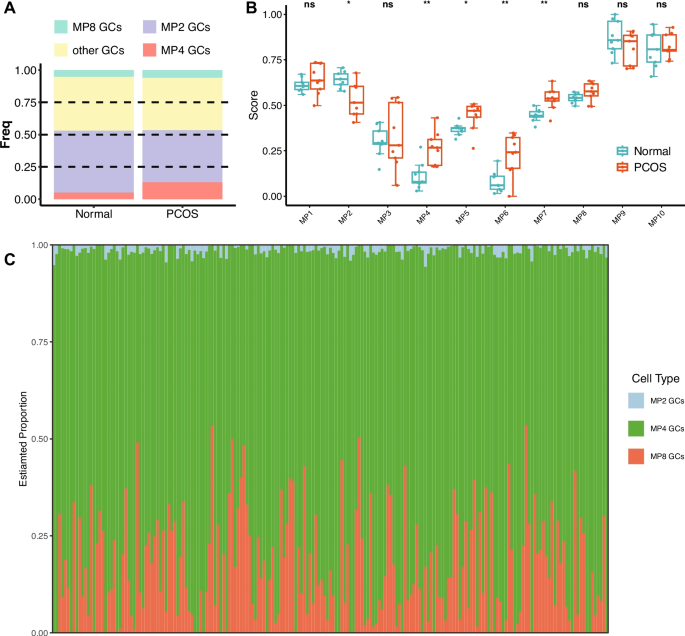
Metaprogram Analysis Reveals Molecular Signatures and Cellular Heterogeneity in PCOS Granulosa Cells. A PCA of single-cell RNA-seq samples. B Heatmap showing the expression of 10 identified MPs across samples. C Differential expression of MPs between PCOS and normal granulosa cells. D t-SNE visualization of six cell clusters and corresponding MP expression patterns in PCOS and normal samples. E Secondary clustering of granulosa cells based on MP expression, identifying four distinct GC subtypes and their corresponding MP expression profiles. F Expression patterns of key markers across the four GC subtypes. G GO, HALLMARK, and KEGG pathway enrichment analysis for MP4, highlighting pathways related to oxidative stress and stress-response signaling
Analysis of metaprogram distribution revealed distinct patterns associated with disease status. Metaprograms MP1-3 and MP8-10 were stably expressed across all samples, indicating their involvement in fundamental cellular processes independent of disease state. In contrast, MP4-7 demonstrated PCOS-specific expression patterns.
Gene set enrichment analysis revealed distinct biological functions for each metaprogram. Notably, MP4 showed significant enrichment in pathways related to cellular response to endogenous stimuli, oxygen-containing compounds, programmed cell death, reactive oxygen species, hypoxia, mitogen-activated protein kinase (MAPK) signaling, transforming growth factor-beta (TGF-β) signaling, and Wingless/Integrated (WNT) signaling pathways. This functional profile strongly implicates MP4 in oxidative stress responses and stress-induced signaling cascades known to be dysregulated in PCOS.
To characterize cellular Heterogeneity, we performed unsupervised clustering using the first 30 principal components with a resolution parameter of 0.2, resulting in distinct cell clusters visualized by t-SNE. UCell score calculation for all 10 metaprograms revealed significant associations between specific metaprograms and cell clusters: MP2 scores were significantly higher in cluster 0 (0.17 ± 0.09 vs 0.05 ± 0.05, p < 0.001); MP4 scores were elevated in cluster 2 (0.25 ± 0.09 vs 0.07 ± 0.05, p < 0.001); and MP8 was predominantly expressed in cluster 3 (0.22 ± 0.06 vs 0.11 ± 0.05, p < 0.001). Based on these patterns, we designated cluster 0 as MP2 granulosa cells (GCs), cluster 2 as MP4 GCs, cluster 3 as MP8 GCs, and remaining cells as other GCs. Notably, the proportion of MP4 GCs was significantly higher in PCOS samples compared to normal controls as determined by Wilcoxon rank-sum test with p = 0.0046, suggesting that expansion of MP4-expressing granulosa cells may be a characteristic feature of PCOS pathophysiology.
Differential expression analysis identifies common dysregulated genes in PCOS
Table 1 presents the clinical and endocrine characteristics of study participants. PCOS and control groups were successfully matched with no significant differences in age (29.00 ± 3.84 vs. 29.78 ± 3.31 years, p = 0.651), BMI (22.03 ± 3.12 vs. 23.12 ± 3.11 kg/m2, p = 0.47), and TSH levels (1.86 ± 1.03 vs. 2.05 ± 1.31 mIU/L, p = 0.732). As expected for PCOS pathophysiology, patients exhibited significantly elevated basal luteinizing hormone (LH, 7.36 ± 2.07 vs. 3.02 ± 0.75 IU/L, p < 0.001), testosterone (1.08 ± 0.43 vs. 0.65 ± 0.19 nmol/L, p = 0.014), anti-Müllerian hormone (AMH) levels (6.96 ± 2.21 vs. 3.80 ± 1.42 ng/mL, p = 0.002), and antral follicle counts (24 vs. 14, p < 0.001) compared to controls. During ovarian stimulation, PCOS patients yielded significantly more oocytes (20 vs. 13, p = 0.024) and mature oocytes (15 vs. 11, p = 0.022), consistent with their enhanced follicular development potential. These findings confirm the distinct hormonal and reproductive characteristics of our PCOS population while validating the effectiveness of our matching strategy for potential confounding variables.
Table 1 Clinical Characteristics and Hormonal Profiles of PCOS Patients and Control Subjects
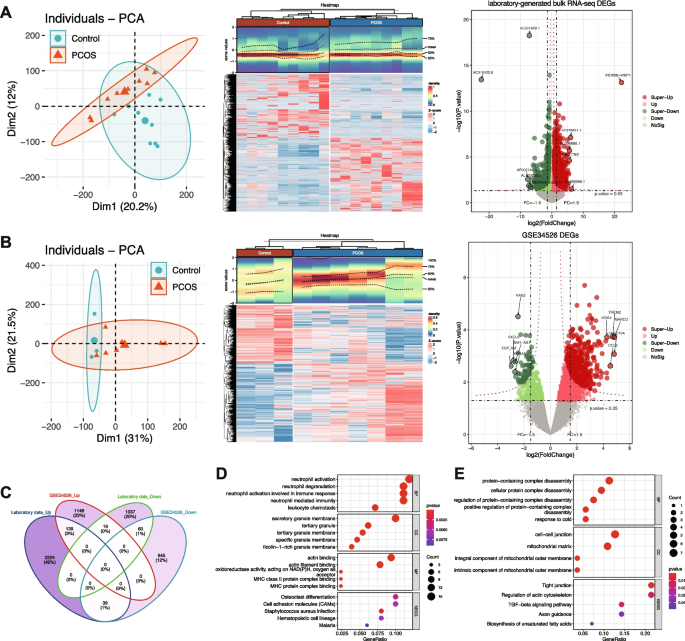
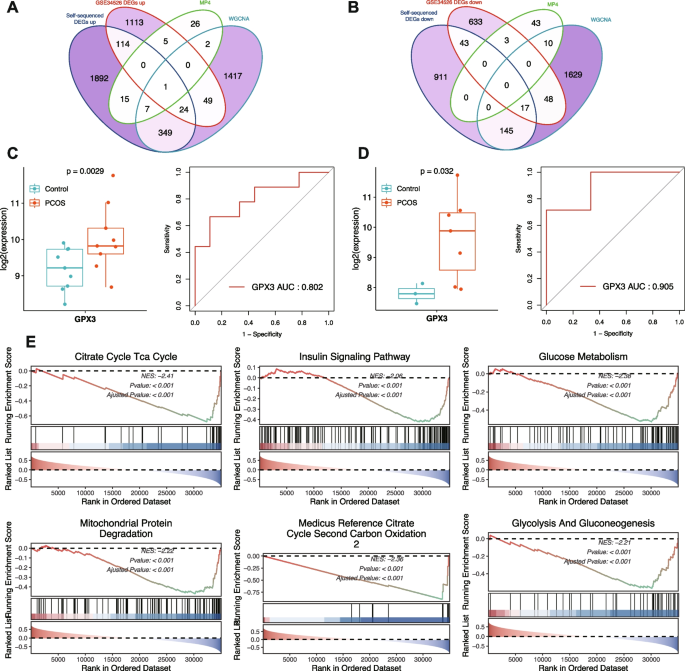
Differential expression analysis was performed on two independent datasets utilizing different transcriptomic platforms: our laboratory-generated bulk RNA-seq dataset (9 PCOS and 9 normal samples) and the publicly available GSE34526 microarray dataset (7 PCOS and 3 normal samples) (Fig. 3). Principal component analysis confirmed clear separation between PCOS and control samples after normalization in both datasets. To account for the fundamental differences between these technologies, we employed platform-specific analytical approaches. For our RNA-seq dataset, DESeq2 analysis with criteria of |FoldChange|> 1.5 and P < 0.05 identified 3,518 differentially expressed genes (DEGs), including 2,402 upregulated and 1,116 downregulated genes in PCOS samples. For the GSE34526 microarray dataset, Limma analysis with the same fold-change and significance thresholds identified 2,050 DEGs (1,306 upregulated and 744 downregulated).
Fig. 3
Differential Expression Analysis Identifies Common Dysregulated Genes in PCOS. A Analysis of the laboratory-generated bulk RNA-seq dataset: PCA plot of samples (left), heatmap of DEGs (middle), and volcano plot highlighting upregulated and downregulated genes (right). B Analysis of the GSE34526 dataset: PCA plot of samples (left), heatmap of DEGs (middle), and volcano plot (right). C Venn diagram showing the overlap of DEGs between the two datasets. D GO and KEGG pathway enrichment analysis of commonly upregulated genes. E GO and KEGG pathway enrichment analysis of commonly downregulated genes
To identify consistently dysregulated genes across different patient cohorts, we determined the intersection of DEGs from both datasets, considering the direction of expression changes. This stringent approach yielded 139 commonly upregulated and 60 commonly downregulated genes across both datasets. Functional enrichment analysis of common upregulated genes identified 13 KEGG pathways and 236 GO terms, while common downregulated genes were enriched in 5 KEGG pathways and 21 GO terms. Upregulated genes were significantly associated with pathways related to cellular response to stress, inflammatory processes, and signaling cascades. Downregulated genes were enriched in metabolic pathways and cellular homeostasis processes. These patterns suggest that PCOS is characterized by enhanced stress response mechanisms coupled with impaired metabolic functions.
WGCNA identifies co-expression modules associated with PCOS
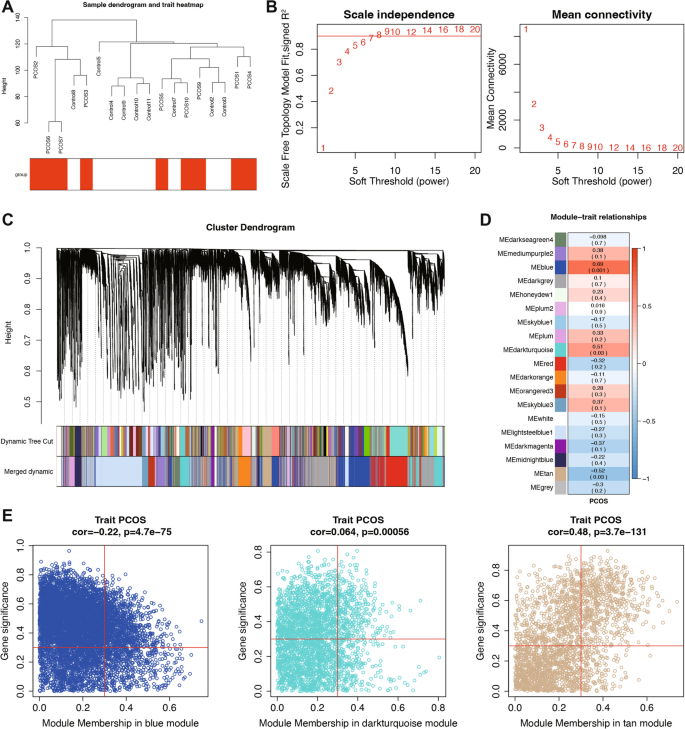
To identify co-expressed gene networks associated with PCOS, we performed WGCNA on the laboratory-generated dataset (Fig. 4). Hierarchical clustering of samples confirmed appropriate grouping without outliers. A soft threshold power of 8 was selected based on scale-free topology criteria (R2 = 0.9) and mean connectivity analysis, ensuring optimal network construction while preserving biological relevance. Using dynamic tree cutting with a minimum module size of 100 genes and a cut Height of 0.4, we identified 19 distinct co-expression modules.
Fig. 4
WGCNA Identifies Co-expression Modules Associated with PCOS. A Sample dendrogram and trait heatmap illustrating clustering of samples and their association with PCOS. B Analysis of scale independence and mean connectivity to determine the optimal soft threshold for network construction. C Cluster dendrogram of genes, showing module assignment based on hierarchical clustering. D Module-trait relationships, indicating correlations between module eigengenes and PCOS status. E Scatter plots showing module membership correlation with PCOS status for the blue, darkturquoise, and tan modules
Correlation analysis between module eigengenes and PCOS status revealed significant associations for several modules. Among these, the blue, darkturquoise, and tan modules exhibited the strongest correlations with disease status (correlation coefficient > 0.3, P < 0.05). To identify key regulatory genes within the PCOS-associated modules, we calculated the correlation between individual genes and both module membership (MM) and gene significance for PCOS (GS). By applying thresholds of MM > 0.3 and GS > 0.3, we identified 1,849 hub genes with strong connections to both their respective modules and PCOS status. These hub genes represent potential master regulators of the transcriptional networks dysregulated in PCOS.
Metaprogram validation in bulk RNA-seq data confirms single-cell findings
To validate the relevance of single-cell-derived metaprograms at the tissue level, we first analyzed their distribution across granulosa cell subsets in single-cell RNA-seq data (Fig. 5A). Metaprogram composition varied across different granulosa cell clusters, with distinct enrichment patterns in PCOS and normal samples.
Fig. 5
Metaprogram Validation in Bulk RNA-Seq Data Confirms Single-Cell Findings. A Stacked bar plot showing the distribution of MPs across different granulosa cell populations in single-cell RNA-seq data. B Differential expression of MPs in bulk RNA-seq data, comparing PCOS and normal samples. ns = not significant, * p < 0.05, ** p < 0.01. C Deconvolution analysis of 193 GTEx ovary samples showing the relative proportions of MP2 GCs, MP4 GCs, and MP8 GCs
To further bridge the gap between single-cell and bulk transcriptomic analyses, we employed single-sample Gene Set Enrichment Analysis (ssGSEA) to score each metaprogram in bulk RNA-seq samples (Fig. 5B). This approach quantified the activity of each transcriptional program in both PCOS and normal cohorts. Comparative analysis of metaprogram ssGSEA scores revealed significant differences in MP2, MP4, MP5, MP6, and MP7 activity. Consistent with single-cell findings, MP2 exhibited higher activity in normal samples, while MP4, MP5, MP6, and MP7 were upregulated in PCOS samples. The differential activity of these metaprograms in bulk tissue samples corroborates our single-cell findings and further supports the pathological relevance of these transcriptional programs in PCOS. In particular, the consistent upregulation of MP4 across both single-cell and bulk analyses reinforces its potential role as a key driver of PCOS pathophysiology.
To validate that the identified granulosa cell subtypes represent genuine biological entities rather than clustering artifacts, we performed deconvolution analysis on 193 GTEx v10 ovary bulk RNA-seq samples. The analysis successfully detected all three major granulosa cell subtypes (MP2, MP4, and MP8 GCs) across the tissue samples (Fig. 5C).
The deconvolution results revealed consistent patterns of cell type proportions across samples. MP4 GCs constituted the predominant subtype in most samples, typically representing 60–80% of the granulosa cell population. MP8 GCs showed intermediate abundance (approximately 10–30%), while MP2 GCs were consistently detected at lower proportions (5–15%). This abundance hierarchy (MP4 > MP8 > MP2) was remarkably stable across the majority of samples, with only minor variations observed in individual cases.
The successful detection of these cellular subtypes in independent bulk tissue samples, with reproducible relative abundance patterns, provides strong evidence that our single-cell-defined metaprograms correspond to biologically meaningful cell states rather than technical artifacts.
Integrative transcriptomic approach identifies key regulator in PCOS pathophysiology
To identify high-confidence key regulators involved in PCOS pathophysiology, we performed an integrative analysis combining three complementary approaches: MP4 signature genes from single-cell analysis, common differentially expressed genes across bulk datasets, and hub genes from WGCNA modules (Fig. 6). This stringent multi-dimensional filtering strategy identified GPX3 as the only gene that consistently emerged across all three analytical approaches. The convergence of these independent methods strongly suggests its central role in PCOS-associated transcriptional dysregulation, particularly in relation to oxidative stress responses.
Fig. 6
Integrative Transcriptomic Analysis Identifies GPX3 as a Key Regulator in PCOS. A Venn diagram showing the intersection of DEGs, WGCNA hub genes, and MP4 signature genes (upregulated). B Venn diagram showing the intersection of DEGs, WGCNA hub genes, and MP4 signature genes (downregulated). C Left: Box plot displaying GPX3 expression differences between PCOS and normal samples in the laboratory-generated dataset. Right: ROC curve assessing the diagnostic value of GPX3 in the same dataset. D Left: Box plot showing GPX3 expression differences in the GSE34526 dataset. Right: ROC curve from the GSE34526 dataset, validating the diagnostic potential of GPX3. E Single-gene GSEA of GPX3, revealing its association with metabolic and mitochondrial pathways, including the citrate cycle, insulin signaling, glucose metabolism, and mitochondrial protein degradation (NES < 0, adjusted P < 0.001 for all pathways)
Expression analysis confirmed significant upregulation of GPX3 in PCOS samples compared to normal controls across both the laboratory-generated dataset and the GSE34526 validation dataset. ROC curve analysis demonstrated strong discriminatory power of GPX3 between PCOS and normal samples in both the laboratory-generated dataset (AUC = 0.802) and the GSE34526 validation dataset (AUC = 0.905), highlighting its potential as a clinically relevant biomarker for PCOS diagnosis.
Examination of GPX3 expression at the single-cell level revealed specific distribution patterns across granulosa cell subpopulations. Single-gene Gene Set Enrichment Analysis identified 818 significantly enriched pathways (|Normalized Enrichment Score, NES|> 1, p.adjust < 0.05, q.value < 0.2), with those related to glucose metabolism, mitochondrial protein degradation, insulin signaling, citrate cycle, and TCA cycle prominently represented. These enrichment patterns suggest that GPX3 dysregulation may impact fundamental metabolic processes and energy homeostasis, which are known to be perturbed in PCOS.
Multi-level GPX3 regulatory network analysis reveals potential mechanisms in PCOS
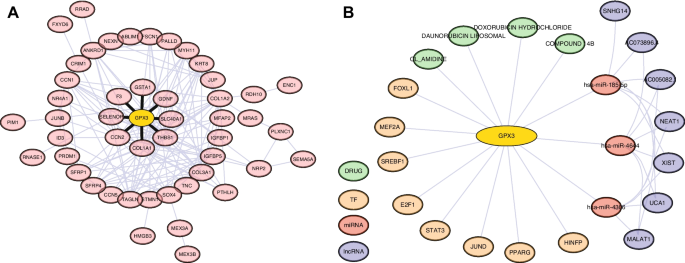
To establish a comprehensive understanding of the functional relevance of GPX3 in PCOS pathophysiology, we performed integrative multi-levels analysis constructing a complex regulatory network (Fig. 7). The protein–protein interaction network based on MP4 signature genes revealed GPX3 in a network comprising 49 proteins with multiple functional connections. Within this network, GPX3 demonstrated direct interactions with several proteins involved in redox homeostasis and related cellular processes.
Fig. 7
Multi-level Regulatory Network Analysis of GPX3 in PCOS. A PPI network of GPX3 and its associated proteins. B Integrated regulatory elements of GPX3 including: ceRNA network prediction showing GPX3-miRNA-lncRNA interactions; Transcription factor binding site prediction; Drug-gene interaction prediction for potential therapeutic targets
Most notably, GPX3 showed significant connections with selenoprotein P (SELENOP), a major selenium transport protein that works synergistically with GPX3 in the selenium-dependent antioxidant system, providing essential selenium cofactors for glutathione peroxidase activity. Similarly, glutathione S-transferase alpha 1 (GSTA1) exhibited direct interaction with GPX3, suggesting coordinated roles in glutathione metabolism and detoxification of reactive oxygen species. These interactions highlight GPX3’s central position in cellular antioxidant defense mechanisms.
Additionally, GPX3 directly interacts with SLC40A1 (ferroportin), an iron exporter critical for preventing iron-catalyzed oxidative damage, connecting iron homeostasis with antioxidant defense in granulosa cells. Interactions between GPX3 and both THBS1 and F3 suggest linkages between oxidative stress and PCOS-related coagulation and inflammatory pathways. Additionally, the associations with extracellular matrix proteins COL1A1 and CCN2 indicate involvement in oxidative stress-induced matrix remodeling. The connection with GDNF suggests novel neuroendocrine regulatory mechanisms influenced by oxidative status in PCOS pathophysiology.
Our miRNA-mRNA interaction analysis identified several microRNAs potentially regulating GPX3 expression, including has-miR-4644, hsa-miR-4306 and hsa-miR-185-5p, both predicted with high confidence scores. Further exploration through miRNA-lncRNA association analysis uncovered a complex layer of epigenetic regulation, with multiple long non-coding RNAs (lncRNAs) including XIST, UCA1, SNHG14, AC073896.4, MALAT1, NEAT1, and AC005082.1 potentially modulating these miRNA-mediated effects on GPX3 expression.
Transcription factor binding site analysis revealed that GPX3 expression may be regulated by several key transcription factors implicated in ovarian function, including SREBF1, HINFP, E2F1, STAT3, PPARG, MEF2A, FOXL1, and JUND. This suggests multiple potential mechanisms for transcriptional dysregulation of GPX3 in PCOS pathogenesis.
Furthermore, drug-gene interaction queries identified several compounds potentially targeting the GPX3-associated pathway, including DOXORUBICIN HYDROCHLORIDE, DAUNORUBICIN LIPOSOMAL, CL_AMIDINE, and COMPOUND 14B, providing potential therapeutic avenues for further investigation. Collectively, this integrative analysis positions GPX3 within a complex regulatory network essential for redox homeostasis in ovarian function, with multiple layers of regulation that may be disrupted in PCOS pathophysiology.
The award-winning broadcaster Kaye Adams has spoken of her distress after she was taken off air by BBC Radio Scotland as a result of an unspecified “conduct complaint”, resulting in relentless media speculation.
Formula One driver Liam Lawson said that he narrowly avoided a fatal collision with two marshals who ran across the racetrack at the Mexico Grand Prix.
This randomized, blinded, controlled trial was conducted at First People’s Hospital of Yichang (The People’s Hospital of China Three Gorges University), approved by its Ethics Committee on December 12, 2022…
This request seems a bit unusual, so we need to confirm that you’re human. Please press and hold the button until it turns completely green. Thank you for your cooperation!