
Down an alley in Covent Garden, on a building that was once a banana warehouse, there is a blue plaque. “Monty Python, Film Maker, Lived Here, 1976-1987,” reads the inscription. It’s easy to miss: the plaque is not at eye level as they…
Blog
-

It protects babies against antibiotic resistance
Often referred to as “liquid gold,” breast milk supports not only for children’s physical health but also for their emotional well-being. It has been linked to greater protection against infections, a lower risk of overweight and type 2…
Continue Reading
-
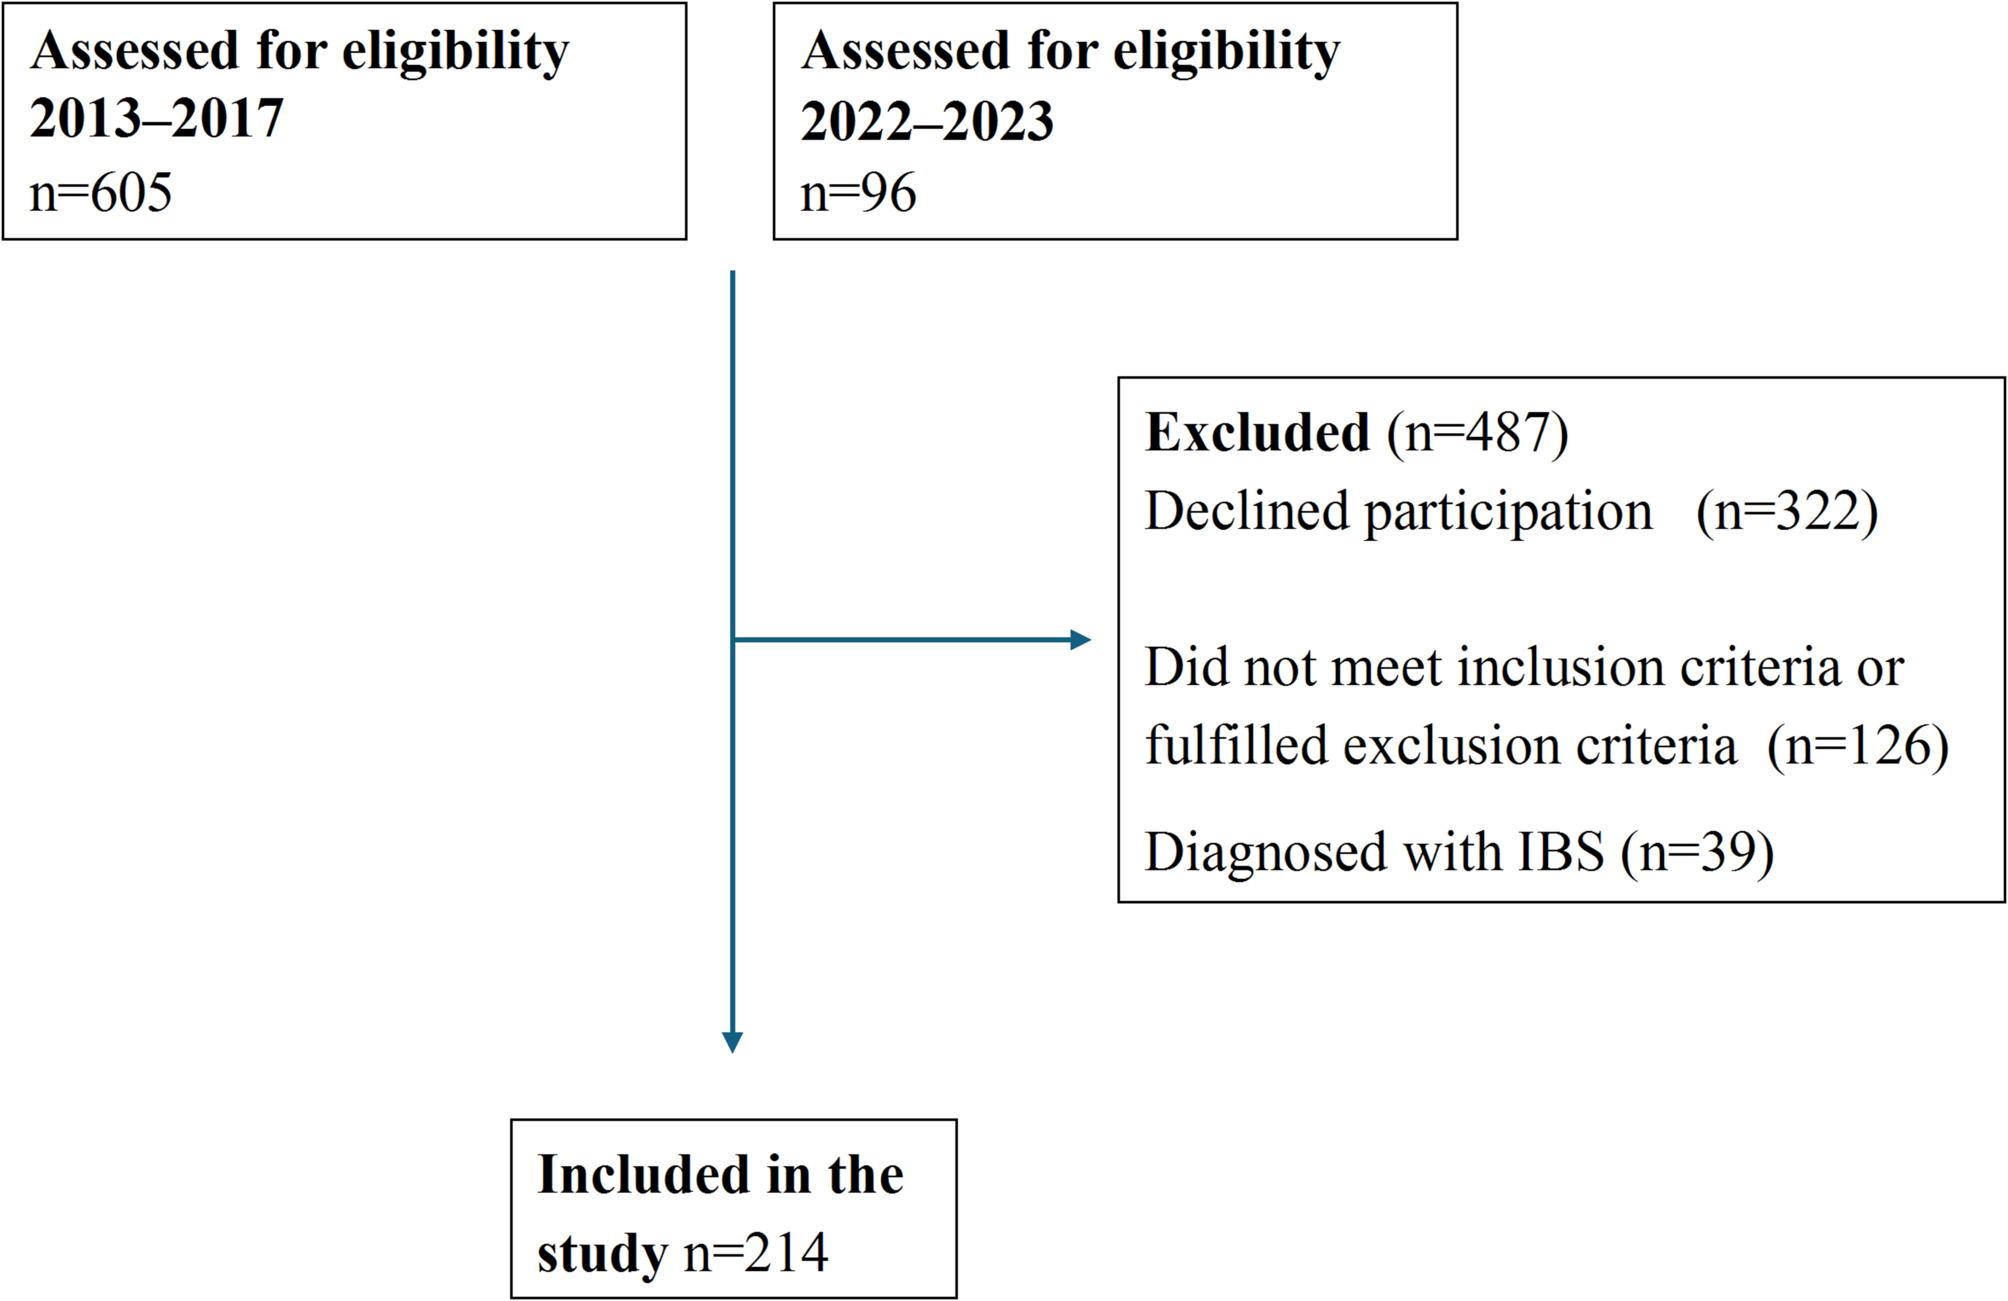
Comparison of sociodemographic factors, lifestyle, and gastrointestinal symptoms between patients with endometriosis and IBS | BMC Gastroenterology
Recruitment of endometriosis patients took place during March 2013–March 2017, and February 2022–March 2023 at the Department of Gynecology at Skåne University Hospital, Malmö, Sweden. Exclusion criteria were multiple or severe somatic or…
Continue Reading
-

Engineering for a better world: How GEA Is transforming industrial ecosystems
The solution: Making sustainability everyone’s business
GEA’s response to the Scope 3 challenge is not to create a new sustainability silo, but to weave decarbonization into the very fabric of its operations from governance, innovation, product design, to sales. The result is a strategy that aligns climate goals with commercial advantage.
The transformation began by redefining who owns sustainability. It started at the top: the Global Executive Committee leads by example – while the Chief Sustainability Officer, as part of the GEC, ensures that climate considerations are embedded in every strategic decision. Executive compensation is directly linked to emissions reductions, including Scope 3, signaling to leadership and shareholders alike that this is core business, not corporate responsibility.
But the shift goes far beyond governance. In 2023, GEA launched its first internal “Sustainathon,” a company-wide innovation sprint modeled on hackathons, designed to crowdsource ideas from employees for reducing product-related emissions. Over five months, 88 employees across divisions developed more than 60 proposals – from energy-saving software tweaks to bold redesigns of key machinery. The winning teams received funding and direct support from top management. “The Sustainathon promotes fresh thinking and encourages employees to develop radical solutions to reduce the emissions of popular GEA products,” explains Wolfgang Deis, GEA Innovation Process Manager.
With a mobilized workforce and incentives in place, GEA turned to the challenge of reducing emissions across its value chain. The answer: enable customers and suppliers to cut their own emissions, while growing business in the process.
One breakthrough came with the Add Better ecolabel, a third-party validated label that identifies GEA machines and systems that outperform their predecessors by a measurable margin in energy or water efficiency. It’s a simple but powerful proposition for factory operators: invest in new equipment that not only performs better but cuts costs and emissions. GEA’s E-Bake solutions, for example, modernize the baking process with electric heating systems that cut energy use by up to 40% compared to gas models.
Retrofit options enable a switch from gas to electric, saving up to 14%. As resource-efficient technologies, they proudly carry the Add Better label. “Solutions in our Add Better portfolio help customers tackle rising energy costs, resource scarcity, and operational risks,” explains Sterley.
For a holistic analysis of an entire production process, GEA supports customers with Add Better Consulting – a dedicated strategy service that helps set priorities, define roadmaps, and develop effective transition plans. As the essential starting point, Add Better Consulting turns ambition into actionable plans, providing tailored decarbonization strategies, plant transition blueprints, and concrete budget considerations.
Building on these foundations, GEA brings the strategies and blueprints to life with NEXUS, an integrated engineering service solution that optimizes entire production systems – from heating and cooling to cleaning and recovery. The goal is to reengineer processes, not just machines. These end-to-end solutions unlock deep energy and emissions savings, while enhancing operational resilience. For example, GEA’s innovative low-carbon heat network at Heineken’s Manchester brewery demonstrates how integrating sustainable heat recovery solutions can significantly reduce energy consumption and emissions in large-scale manufacturing
These initiatives have helped GEA cut product-related emissions by a third since 2019.
These are not compliance-driven activities. For GEA, sustainability has become a platform for innovation, competitive advantage, and long-term growth. With 41.6% of its revenue already coming from its sustainable product portfolio, and with a target of 60% by 2030, GEA is effectively transforming its business model and the industrial ecosystem in which it operates.
Continue Reading
-

financial conditions and credit dynamics
Welcome address by Philip R. Lane, Member of the Executive Board of the ECB, at the 5th WE_ARE_IN Macroeconomics and Finance Conference 2025
Frankfurt am Main, 21 October 2025
It is an honour to participate in the fifth edition of the WE_ARE_IN Macroeconomics and Finance Conference and I congratulate the organising committee for putting together an excellent programme.
Let me start this speech by outlining how the ECB makes monetary policy decisions.[1] As expressed in our monetary policy statement:[2]
The Governing Council is determined to ensure that inflation stabilises at its 2% target in the medium term. It will follow a data-dependent and meeting-by-meeting approach to determining the appropriate monetary policy stance. In particular, the Governing Council’s interest rate decisions will be based on its assessment of the inflation outlook and the risks surrounding it, in light of the incoming economic and financial data, as well as the dynamics of underlying inflation and the strength of monetary policy transmission. The Governing Council is not pre-committing to a particular rate path.
My aim today is to review one dimension of this multi-pronged assessment: how we assess the strength of monetary policy transmission. In what follows, I describe some of the analysis that has underpinned this assessment in recent monetary policy meetings.
I will begin by outlining the contribution of monetary policy to financial conditions before reviewing aggregate credit dynamics. Next, I will move to three key factors in determining monetary transmission: first, heterogeneity across member countries; second, the implications of a high level of uncertainty for monetary transmission; and third, the transmission impact of external factors, namely trade tensions and the exchange rate.
Between July 2022 and September 2023, the ECB raised interest rates from -50 basis points to 400 basis points.[3] After a nine-month holding phase, the monetary policy easing cycle started in June 2024. Between then and June 2025, we lowered our policy rates by a cumulative 200 basis points. Since June, our policy rates have remained unchanged.
In capturing the impact of changes in policy rates on the wider financial environment, it is useful to assess blended measures such as financial conditions indices (FCIs), which synthesise the information from a variety of financial asset prices. As such, FCIs extend the concept of the monetary policy stance to a wider set of financial markets and beyond the level of accommodation or restrictiveness that is under the central bank’s direct control. Akin to a stance measure, loose or tight financial conditions tend to stimulate or dampen economic activity, thus representing an upside or downside force acting on inflation.
Typically, FCIs combine – in a static manner that does not allow for feedback from the economy – a broad set of financial variables, including risk-free rates, sovereign and corporate spreads, equity valuations and exchange rates. It is a standard part of our assessment to study a range of FCI measures, including those developed at the ECB, international policy organisations and private-sector versions. Today, I will focus on a new addition to the family of FCI measures: a new “Macro-Finance” FCI that has been developed by ECB staff in order to overcome the “lack of feedback” problem. [4]
The new methodology incorporates mutual feedback between macroeconomic and financial dynamics, such that the Macro-Financial FCI reflects the joint dynamics of macroeconomic variables and financial conditions. As can be seen from the left panel of Chart 1, the overnight rate (€STR), which is closely tied to our policy rates, typically comoves with and sets the direction of the overall index. But there are also several phases in which financial conditions have moved even when the policy rate was stable (Chart 1, left panel).
The decomposition (Chart 1, middle panel) illustrates that, at the onset of the global financial crisis in 2008, plummeting risk asset prices (dark green area) turned from being a stimulative influence on the FCI to acting as a sudden and sharply tightening factor. The widening of sovereign bond spreads during the European debt crisis (light blue area) also provided extra restriction in the years around 2012. During the episode when policy rates were close to their lower bound, compressed long-term nominal rates and negative real interest rates were important sources of accommodation. As a result, the Macro-Finance FCI reached historically supportive levels in late 2021. It then climbed rapidly in the run-up to the first interest rate hike in July 2022, since the term structure of interest rates sequentially moved higher well ahead and in anticipation of our rate hikes and quantitative tightening.
Chart 1
A new “Macro-Finance Financial Conditions Index”
(percentages)
Source: Bletzinger T., Martorana, G. and Mistak, J. (forthcoming).
Notes: The left panel plots the Macro-Finance FCI alongside the €STR. The middle panel shows the index and its decomposition, with contributions estimated in a macro-finance model (Bletzinger, T. et al., forthcoming). The “Short rate” refers to the €STR, the “Long rate” to the ten-year nominal OIS rate, “Real rates” to the one-year real OIS rate in one year’s time and the five-year real OIS rate, “Sov. spreads” to the two- and ten-year euro area GDP-weighted sovereign bond spreads over OIS rates, “Risk assets” to investment-grade corporate bond spreads and the CAPE ratio, and “Euro fx” to the NEER of the euro. The right panel compares the joint fit of euro area HICP inflation and the composite PMI when substituting the index with other measures in the model. The fit of the Macro-Finance FCI is normalised to 100, and the fit of the other models is expressed relative to that benchmark. The Goldman Sachs FCI refers to Stehn et al. (2019) and the weighted average FCI to Arrigoni et al. (2020). The principal component is the statistical factor that explains most of the variation among the financial market variables entering the Macro-Finance FCI.
The latest observations are for 17 October 2025.
In recent years, the Macro-Finance FCI peaked around the end of the 2022–23 monetary tightening cycle. The increase in the index during this period was primarily driven by rising risk-free rates, with adjustments in risk assets playing a more limited role. Since the peak of the tightening cycle, the index has indicated that financial conditions have become noticeably less restrictive, supported by lower short-term interest rates and higher valuations for risk assets, although this has been partly offset by a stronger euro.
Despite this easing, the level of the Macro-Finance FCI remains well above its historical sample average. In part, this can be attributed to a permanent component to the 2022 shift in the monetary policy stance: the re-anchoring of inflation expectations at the two per cent target means that markets do not expect a return to the “low for long” rate environment that had been expected before the pandemic to continue on an open-ended basis.
The new index outperforms other measures when it comes to describing the macroeconomic dynamics of the euro area (Chart 1, right panel). In this regard, it is key to understand that the financial prices and yields that are aggregated into the Macro-Finance FCI influence bank loan dynamics and loan pricing: this summary statistic of (mostly market-based) financial conditions can be interpreted as an important determinant of broader funding conditions, including those set by the banks, which can be collectively labelled as “financing conditions”. In the next section, we turn to a review of credit dynamics.
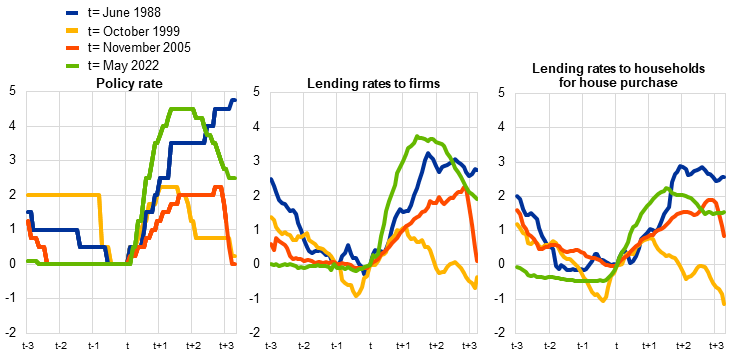
Lending rates have been declining broadly in line with historical regularities (Chart 2). But there is a detectable difference between developments in the lending rates to households and to firms: the relatively muted decrease in long-term market rates has contained the decline in the cost of household loans, which tend to be priced off the longer end of the term structure of interest rates and have longer fixed-rate periods, relative to loans to enterprises. As outlined above, this is consistent with a permanent component in the 2022 upward shift in policy rates, with no return expected to the “low for long” zone.
Chart 2
Lending rates across hiking and easing cycles
(percentages per annum, series normalised at 0 in t, where t corresponds to the beginning of the policy hike)
Sources: ECB (MIR) and ECB calculations.
Notes: The ECB relevant policy rate is the lombard rate up to December 1998, the MRO up to May 2014 and the DFR thereafter. The chart reports differences with respect to June 1988, October 1999, November 2005, May 2022 in each of the two panels. Dates are selected as the first change in policy rates in a hiking cycle.
The latest observations are for August 2025.
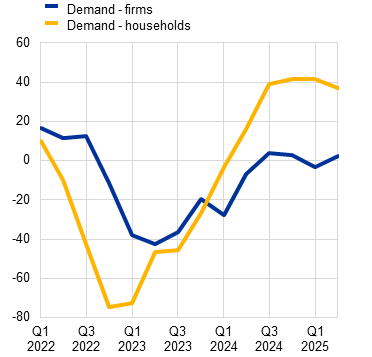
In terms of credit volumes, household borrowing, primarily for home purchases, has increased steadily. According to the bank lending survey (BLS), the recovery in mortgage demand is supported by improved housing market prospects and lower interest rates (Chart 3, panel A). Corporate borrowing is also gradually recovering, though BLS responses suggest that corporate demand for credit remains subdued, also reflecting global uncertainty and trade tensions.[5]
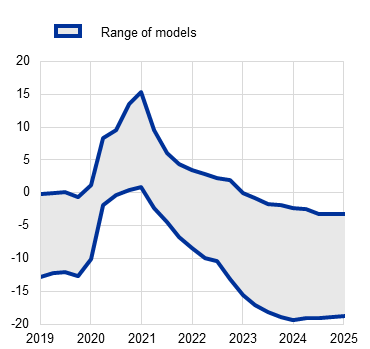
This evidence raises the question of how credit is evolving compared to past regularities, given macroeconomic conditions and considering the current phase of the policy cycle. The strength of credit dynamics relative to the broader economy can be gauged through a credit-to-GDP gap analysis, which captures the deviation of the credit-to-GDP ratio from historical benchmarks.[6] This gap can be estimated using a range of methodologies, from simple univariate approaches to more sophisticated models that account for the broader state of the economy. Regardless of the method, the gap remains in negative territory (Chart 3, panel B). This may reflect both structural factors and cyclical conditions. However, using multivariate models to control for prevailing cyclical conditions does not change the inference: credit seems to be weak if assessed against past regularities.[7]
A number of structural shifts have been cited to explain a diminished role of credit in advanced economies. For example, households spend less on durable goods and more on services, for which they do not typically need to borrow. Demographic trends can reinforce these trends and explain why mortgages might be in lower demand than in the past. Also, spending on intangible assets – including intellectual property, software and code – has surpassed tangible investments as a share of GDP in major economies since the global financial crisis. And intangibles tend to be financed using internal funds or equity, being harder to pledge as collateral for loans. Even the AI-related investment boom in physical infrastructure, including data centres, has been primarily financed by equity.
But such structural shifts matter less for the euro area than for other economies, which leaves the effects of the previous tightening cycle as an important candidate explanation for the persistent weakness in credit that we observe today.[8] That is, the current credit dynamics most likely reflect the cross-currents arising from the recent easing overlapping with the delayed effects of the past tightening, together with the fact that there is a permanent component to the rate tightening compared to the pre-pandemic levels. For instance, lending rates on new loans are still above those on outstanding loans, and BLS indicators show that the cumulative tightening has not yet been fully reversed.
Chart 3
Credit dynamics
Changes in demand for loans to firms and households
Credit-to-GDP gap across univariate filters and multivariate model-based approaches
(net percentages of banks reporting an increase in demand)
(percentages of GDP)
Sources: Left panel: ECB (Bank Lending Survey). Right panel: BIS, ECB and ECB calculations.
Notes: Left panel: the indicators report net percentages for the questions on demand for loans, defined as the difference between the sum of the percentages of banks responding “increased considerably” and “increased somewhat” and the sum of the percentages of banks responding “decreased somewhat” and “decreased considerably”. The indicator for households refers to loans for house purchases. Right panel: the shaded area reports the range of gap estimates across an ensemble of methods and definitions of total credit, using univariate filtering techniques and multivariate models.
The latest observations are the second quarter of 2025 (July 2025 BLS) for the left panel and the first quarter of 2025 for the right panel.
A range of other factors that are not unrelated to the cycle may also help explain why the credit gap indicators remain negative. Heightened risk perceptions and higher bank funding costs, combined with declining excess liquidity, have played a role. In addition, pressures from supervisory and regulatory requirements to maintain solid balance sheets amid rising uncertainties, alongside the goal of supporting financial stability, have kept credit standards tight through the cycle, even as monetary policy has been eased in recent quarters. At the same time, financing from non-bank lenders has remained contained since the start of the monetary policy tightening, despite their secular increasing role in funding the real economy.
Looking in more detail at the sources of external financing for firms other than borrowing from banks, corporate bond issuance has benefited from foreign inflows into euro area bond funds in recent quarters, amid a shift in investor cross-border funds in favour of the euro area. Non-listed equities have also increased recently, likely reflecting activities of private equity funds. One segment of non-bank financing that has been growing significantly in recent years is private credit. Private credit generally refers to non-bank corporate credit provided through bilateral agreements or small “club deals” involving lenders outside the realm of securities investors or commercial banks. Despite a clear expansion in the euro area over recent years, the lion’s share of private credit is originated in the United States.[9] Although numbers vary depending on the exact definition of private credit and source, the size of private credit in the United States is well above €1 trillion, while for the euro area numbers range from around €100 billion to around €300 billion.[10] Taken together, non-bank financing has not grown enough to counteract the weakness in bank lending. The dynamics of all the sources of external finance for euro area firms, including equity financing, but also trade credit and non-bank financing, remain contained by historical standards (Chart 4), hence overall measures of the credit gap, as shown in Chart 3, remain negative.
On net, the ongoing transmission of monetary policy easing to credit volumes has been more gradual than anticipated building on past regularities. Equally unusual has been the pronounced heterogeneity across sectors and across borrower characteristics, which I will discuss next.
Chart 4
Firms’ external financing over time
(annual percentage change and percentage point contributions)
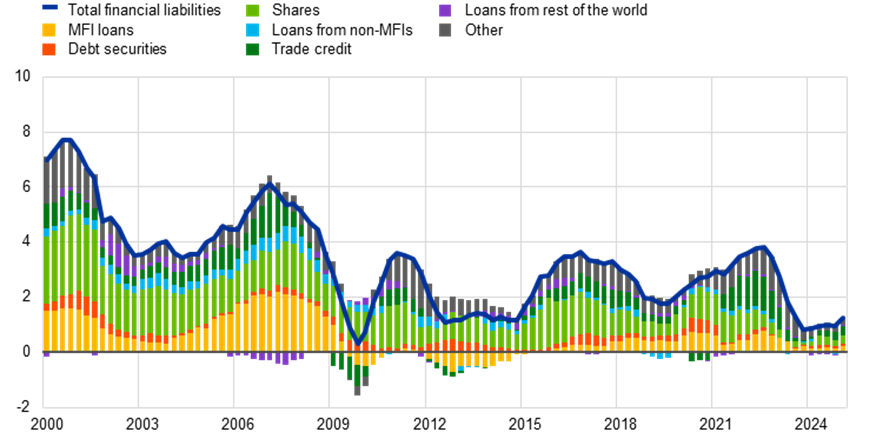
Sources: ECB (QSA, BSI, FVC), Eurostat and ECB calculations.
Notes: MFI loans are corrected for cash polling, loan sales and securitisation. Loans from non-MFIs are corrected for securitisation and they comprise loans from insurance corporations and pension funds (ICPFs) and other financial intermediaries (OFIs). “Other” is the difference between the total and the instruments singled out in the chart; it includes loans from general government, inter-company loans, financial derivatives (net) and other accounts payable other than trade credits.
The latest observations are for the first quarter of 2025.
Heterogeneity in the transmission of monetary policy can affect its overall macroeconomic impact. Differences in sectoral balance sheets and sectoral exposures to macroeconomic shocks can influence the responses of households, firms and banks to changes in financing conditions.[11]
For instance, the growth rate of loans to the manufacturing sector, although recently supported by the surge in activity due to frontloading of euro area shipments to the United States, has been weaker than that of loans to the services sector (Chart 5, Panel A).[12] As manufacturing is capital-intensive, this development connects to the anaemic growth in investment in recent years. Moreover, manufacturing is also working-capital intensive, and therefore especially affected by the cost channel of monetary policy. That a stronger recovery in the manufacturing sector has so far not materialised helps explain a weaker pass‑through of monetary easing via the cost channel than would normally be expected. The underlying reasons could be related to the greater exposure of manufacturing to the external environment, a topic that I will get back to later. By contrast, credit dynamics in the services sector have been driven largely by real estate and leasing activities, supported by recovering domestic demand for housing and durable goods in the euro area.
Chart 5
Heterogeneous credit dynamics across sectors and type of firm
Loans to firms by sector
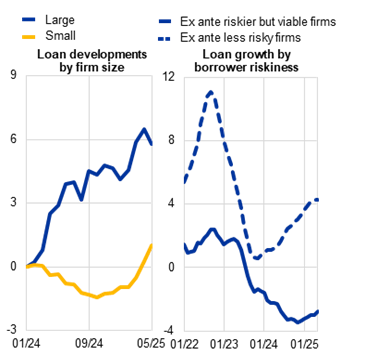
Lending by firm size and riskiness
(left panel: index = 0 for January 2024, right panel: percentages per annum)
(left panel: index = 0 for January 2024, right panel: annual percentage changes)
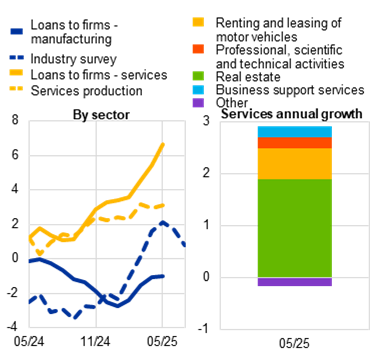
Sources: ECB (ECS, RIAD, BSI, AnaCredit) and ECB calculations.
Notes: Left panel: in the left-hand side chart, the super-sectors are identified from the following NACE sectors: Manufacturing (C), Services (G, H, I, J, L, M, N O, P, Q, R, S, T, U). The industry survey is sourced from ECS and represents the production trend observed in recent three months, while the services production is sourced from STS. The series for the loans to firms in the manufacturing sector and for the industry survey have been smoothed using a three-month moving average. The right-hand side chart represents the growth contribution of selected sectors for April 2025. Right panel: the left-hand side chart represents the index (January 2024 = 0) of the stock of loans by size. Company sizes are defined as small for 50 employees or less, medium for 51 to 250 employees, and large above 250 employees. In the right-hand side chart, loan growth by PD group has been rescaled to match BSI aggregates and purged from PD migrations. High (resp. low) risk firms are those with a PD above (resp. below) 1.6%, the third quartile of PD in lending flows.
The latest observations are for May 2025 for AnaCredit, July 2025 for ECS.
At the firm level, credit growth is increasingly concentrated among larger and less risky firms (Chart 5, panel B). Results from the survey on the access to finance of enterprises (SAFE) confirm that small firms have experienced a more muted decline in external financing costs than larger producers. This points to contained transmission via the balance sheet channel and the risk-taking channel of monetary policy. Smaller firms, being more vulnerable to current macroeconomic risks, have therefore suffered sharper balance sheet losses. At the same time, banks have been more reluctant to extend credit to riskier borrowers.[13] Since small firms also face greater obstacles in accessing alternative sources of funding, banks’ reluctance to lend further tightens the financial constraints facing smaller and riskier firms and weighs on their ability to invest.[14]
Chart 6
Heterogeneous monetary policy pass-through in mortgage and housing markets
Growth momentum of bank loans to households by country
Changes in new mortgage applications by households by income quintile
(percentages per annum)
(percentage points)
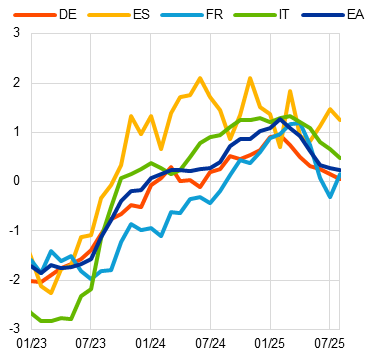
Sources: ECB (BSI, CES) and ECB calculations.
Notes: Left panel: momentum is defined by the difference between the (3m-o-3m annualised) and the annual growth rate. Right panel: The chart reports the percentage point change in the share of households that applied for mortgages relative to before the monetary policy tightening, broken down by income quintile. Income quintiles are computed over the weighted distributions of the variable at the country level and by wave.
The latest observations are for August 2025 for the left panel and July 2025 for the right panel.
Household loan dynamics have also shown dispersion across countries, highlighting the role of both the collateral and cash-flow channels in monetary transmission during the tightening and easing phases of the cycle (Chart 6, panel A). Differences in national mortgage markets are a key factor, reflecting institutional features such as the share of adjustable-rate mortgages (ARMs) and their maturities.[15] Historical regularities show that the pass-through is stronger in mortgage markets with a higher share of adjustable-rate mortgages and shorter maturities, reflecting both the larger movements in short-term compared to long-term market rates and the faster repricing of the total stock of outstanding loans when fixation periods are shorter.[16] Indeed, over the past two decades, floating-rate mortgages — which are more reactive to the policy rates – have become less popular in the major euro area economies. The shift in the types of mortgages means monetary policy takes longer to work its way into households’ debt payments. This delay in transmission means that, despite recent rate cuts, average mortgage rates are expected to rise further and drag on consumption for a number of years to come as households remortgage on to higher rates after completing long-term fixed deals.[17] Moreover, through the collateral channel, recent interest rate cuts have pushed up asset values more in countries with high ARM shares, thereby boosting collateral values.
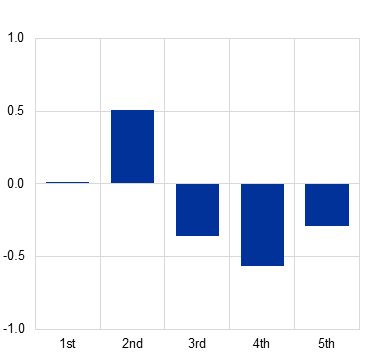
After a period of declining mortgage applications during the tightening period, mortgage applications have started to increase in recent quarters. Higher income households, however, have maintained lower mortgage applications compared to the pre-tightening period (Chart 6, panel B). Instead, mortgage application growth has come mostly from lower-income households, possibly reflecting the need to maintain consumption or housing purchase plans in spite of declining real wages and with less savings, especially if they spend a large share of their income on basic goods. Thus, we see a shift in the composition of mortgage demand.[18]
Summing up, the change in borrower composition and the muted risk appetite of banks point towards the risk-taking and balance sheet channels of monetary policy operating less strongly for lower-income households and smaller firms during the easing cycle. Since these groups typically have higher marginal propensities to consume and invest, this heterogeneity in transmission may reduce the effectiveness of recent interest rate cuts in stimulating aggregate demand in the current context of high global uncertainty.[19]
An important factor that may distort and at times suppress the transmission of monetary policy is uncertainty. Over the past year, economic policy uncertainty has risen sharply, reaching record levels in April, largely driven by trade tensions and geopolitical risks (Chart 7, left panel). Financial market volatility has, instead, remained subdued (Chart 7, right panel). While uncertainty has eased somewhat in recent months, it remains at historically high levels on both sides of the Atlantic according to newspaper-based measures, close to the peak seen during the COVID-19 pandemic.
Monitoring elevated uncertainty is crucial in analysing credit dynamics for two main reasons.
First, it directly lowers credit demand and credit supply. ECB staff finds that unexpected increases in economic policy uncertainty have a negative effect on bank lending in the euro area.[20] When economic policy uncertainty spikes unexpectedly, households and businesses tend to delay their consumption and investment decisions, as the value of waiting for additional information increases.[21] As a result, the financing needs and loan demand of firms drop in synch, as shown in recent BLS replies. On the lender side, banks may adopt a more cautious stance as well, delaying the approval of new loans and thereby affecting the availability of credit within the economy.[22] These effects are amplified if financial market volatility spikes up.
Second, ECB staff also finds that elevated uncertainty diminishes the impact of monetary policy easing on firms’ investment.[23] Even when a central bank lowers rates to encourage banks to lend and firms and households to borrow, spend and invest, the impact may be weaker or slower during periods of heightened uncertainty.
On its own terms, if uncertainty weakens monetary transmission, this implies that a more powerful monetary intervention is required to deliver a given policy objective. At the same time, monetary policymakers must strike a balance between the incentives to act more powerfully and the incentives to wait and see whether an uncertainty spike self-corrects in a timely manner. [24] As noted in our September monetary policy statement, uncertainty has declined compared to the peaks in the second quarter but remains elevated compared to historical norms.
Chart 7
Measures of uncertainty
(left panel: index, right panel: annualised percentage points)
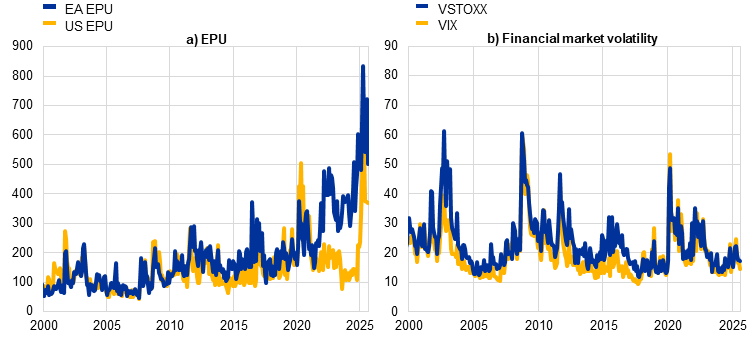
Sources: Baker, Bloom and Davis (2016), Bloomberg and ECB calculations.
Notes: The US EPU and EA EPU are estimated by Baker, Bloom and Davis (2016). The EA EPU is constructed as a GDP weighted average of country-level indices.
The latest observations are for August 2025.
The strength of monetary policy transmission depends on the configuration of the macroeconomic shocks hitting the euro area. Two (interconnected) external shocks are currently shaping euro area macroeconomic dynamics. First, a large portion of the uncertainty highlighted above stems from outside the EU, reflecting unpredictable shifts in foreign economic policies and concerns about the future course of geopolitical tensions. Second, there has been a substantial appreciation of the euro.
The recent tariff agreement between the EU and the United States has eased trade policy uncertainty and overall economic policy uncertainty to some extent, yet important questions remain. A key source of risk is the ongoing tensions in US-China trade relations. If these tensions persist, Chinese exporters would have stronger incentives to redirect shipments toward non‑US markets, heightening competition for European firms.[25] Such increased competition would weigh on demand in export-intensive and import-competing European sectors, reducing corporate earnings and weakening the transmission of monetary easing through the cash flow and balance sheet channels. In addition to these demand-side effects, trade tensions may disrupt supply chains, amplifying the risk faced by banks in lending to firms participating in international trade and thus amplifying conditions of uncertainty.[26]
Trade fragmentation is also heightening concerns about elevated risks to economic conditions. According to the BLS, perceived risks related to the economic outlook have been contributing to a tightening of credit standards since the last quarter of 2024 (Chart 8, panel A), despite the fact that policy rates have been reduced for much of this period.
Based on the sector-country allocation of bank credit to firms that trade with the United States, the greater risk lies with loans to exporters. This is due to the higher relative size of these exposures, and to the specifics of the July tariff agreement, which introduced a broad-based US tariff of 15 per cent for EU goods, although with some exceptions and carveouts (Chart 8, panel B).[27] Looking ahead, it is crucial to keep an eye on the asset quality of lenders that have significant exposure to tariffs. While so far there are limited signs of deterioration in asset quality, banks’ perception of lending to firms more affected by tariffs could impair the supply of credit, weakening the monetary policy easing impulse.
Chart 8
Credit standards and US trade exposure: drivers of corporate lending
Changes in credit standards for loans to firms
US trade exposure
(net percentages of banks reporting a tightening of credit standards and contributing factors)
(percentages of gross value added)
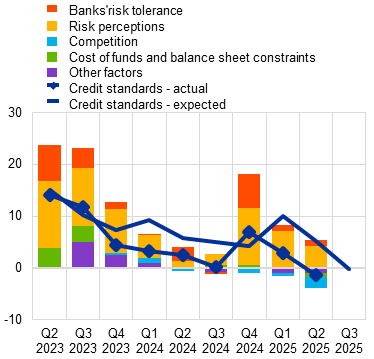
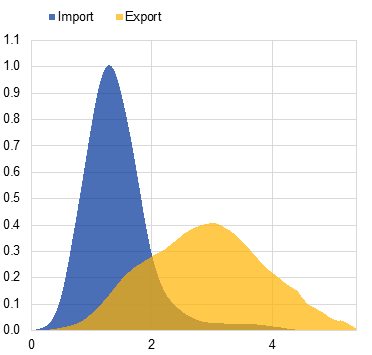
Sources: Left panel: ECB (Bank Lending Survey) and ECB calculations; right panel: ECB (AnaCredit), European Commission and ECB calculations.
Notes: Left panel: “Credit standards – actual” are changes that have occurred, while “Credit standards – expected” are changes anticipated by banks. Net percentages are defined as the difference between the sum of the percentages of banks responding “tightened considerably” and “tightened somewhat” and the sum of the percentages of banks responding “eased somewhat” and “eased considerably”. The net percentages for the “other factors” refer to further factors which were mentioned by banks as having contributed to changes in credit standards for loans. Right panel: trade exposure at the sector level is computed as import or export to the US over gross value added by sector. Trade exposure at the bank level is computed as a weighted average using AnaCredit. The chart represents a kernel density of exposures in December 2024.
The latest observations are for the second quarter of 2025 (July 2025 BLS) for the left panel and December 2024 for the right panel.
Households currently benefit from a strong labour market, a low and stable inflation outlook and favourable conditions in the housing markets. However, those working in certain sectors, in particular manufacturing, are increasingly worried about the negative effects of tariffs, expecting income declines and tighter credit access. As a result, they anticipate submitting fewer credit applications (Chart 9, panel A). At the same time, lower-income households are starting to report increasing difficulties in meeting mortgage payments (Chart 9, panel B). Higher financial distress rates of households pose a downside risk for the transmission of the recent interest rate cuts.[28]
Chart 9
The effects of perceived higher tariff exposure for households’ credit market expectations and increasing household financial difficulties.
US tariffs and households’ credit market expectations
Households’ difficulty meeting mortgage payments
(percentage points)
(percentages of respondents)
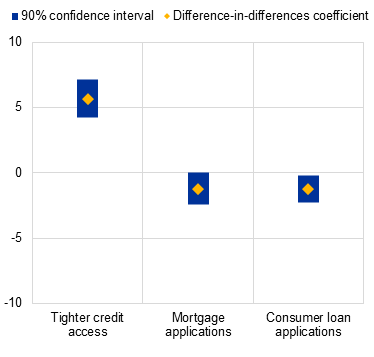
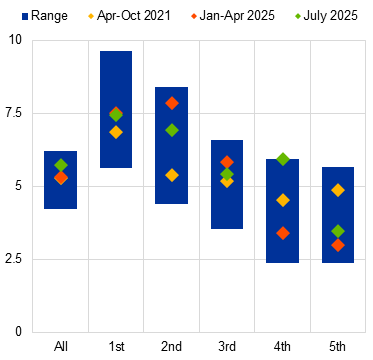
Sources: ECB (CES) and ECB calculations.
Notes: Left panel: the chart shows coefficients from a difference-in-difference regression of expectations of credit market access and applications of households on an indicator for whether the household reported that its financial wellbeing would be negatively affected by US tariffs interacted with a dummy for the period April 2025 to July 2025. Right panel: the chart shows the share of CES respondents reporting difficulties meeting mortgage payments in the past 12 months, by income quintile. Income quintiles are computed over the weighted distribution of the variable at the country level and by wave.
The latest observations are for July 2025.
Turning to the impact of euro appreciation on monetary transmission, there are two broad channels. First, euro appreciation affects credit demand and credit supply through its impact on macroeconomic dynamics. Second, euro appreciation affects the balance sheets and funding conditions of banks.
In relation to the former channel, euro appreciation is typically associated with slower growth and lower inflation over a multi-year horizon. At the same time, the impact varies across euro area corporates, such that it is important to take into account the differences across bank-firm pairs. In one direction, the appreciation of the euro against the US dollar and other currencies lowers price competitiveness for European exporters and import competers. In the other direction, firms that do not have large USD-denominated revenues but pay for intermediate input costs (e.g. energy) in foreign currencies (especially the dollar) benefit from a term-of-trade improvement from euro appreciation.[29]
For credit supply, the net impact via the real economy depends on their client mix: institutions more exposed to tradable sectors may face tougher conditions, but banks with a high presence in the non‑tradable economy may benefit from the stronger purchasing power of their customers (Chart 8, panel B). On the one hand, market analysts are already discounting exposures to the United States in their estimates of euro area banks’ profitability prospects (Chart 10, panel A), despite the overall positive expectations for the sector.[30] On the other hand, an appreciation of the euro improves the euro area’s terms of trade by lowering import prices, supporting real incomes and potentially making borrowers’ balance sheets stronger, eventually increasing banks’ willingness to serve customer segments benefiting from cheaper imports.
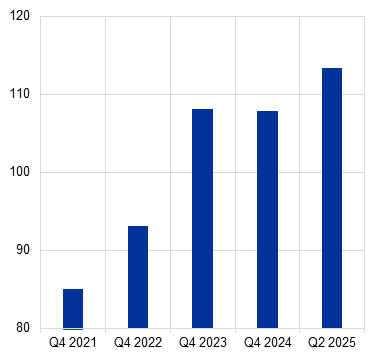
Turning to the latter channel, the depreciation of the dollar has a direct impact on the effective quantity of USD-denominated liquidity. USD-denominated assets constitute an integral part of the liquidity management practices of banks, both for those with active business lines in the United States and for those that use liquid dollar assets as hedging devices.
During the tariff turmoil, the unusual combination of a sell-off in US Treasury securities and a weakening dollar made it more difficult for euro area banks to rely on their USD-denominated liquid assets – once considered safe havens offering downside protection – to cushion lending and funding pressures.[31] Banks with lower USD-denominated liquidity buffers saw their bond spreads widen more sharply. While the USD LCR is not mechanically affected by movements in the exchange rate and the liquidity regulation in the EU generally does not require banks to hold LCR levels in foreign currencies above 100 per cent, excessively low levels of USD LCR may become a source of fragility for banks during episodes of large exchange rate volatility.[32] Since the euro area banking system has made progress in increasing their USD LCRs in recent years (Chart 10, panel B), it did not experience sizeable liquidity strains even at the height of the exchange rate volatility in early April, though the episode may have altered the algebra of liquidity management for the remainder of the year.[33]
Since euro appreciation reflects a global portfolio rebalancing that has triggered higher capital inflows into the euro, this may provide a windfall of funding opportunities for euro area banks while also creating the market conditions that have further contributed to the compression of bank bond spreads. Against this backdrop, bank bond issuance activity has rebounded since May, including a pickup in USD-denominated bonds.[34] Moreover, globally active euro area banks, for which USD funding represents a non-negligible share of total liabilities, can pass through the easier funding conditions to other banks via interbank money market lending.[35]
Euro appreciation also generates valuation losses on the asset side of euro area banks but also effective funding cost reductions on the liability side. The repercussions of these two countervailing effects on the intermediation capacity of banks and credit supply depends on the aggregate net exposure but also on whether exposures via assets and liabilities are unevenly distributed in the cross-section.
Exposures on the asset side can be sizeable. Total USD exposures represented almost 10 per cent of the assets of the euro area banking system in the second quarter of 2025.[36] Among the banks with USD asset exposures, the interquartile range of the ratio of these exposures over total assets lies between 5 per cent and 25 per cent as at the second quarter of 2025, with around one half of the overall exposures accounted for by loans of banking groups active outside of the euro area (Chart 11, Panel A). In general, the valuation impact is relatively contained when cast against the capital buffers of the euro area banking system or previous episodes of valuation losses associated with, for instance, fluctuations in the value of sovereign holdings.
Moreover, euro area banks also have a substantial part of liabilities denominated in USD, with an interquartile range ranging between 7 per cent and 28 per cent as at the second quarter of 2025, and with a total amount similar to that of assets. A substantial share (43 per cent) of USD-denominated liabilities is provided by financial entities (Chart 11, panel B) and is therefore relatively volatile, especially during market turbulence. Overall, the net exposure in USD is rather stable over time: for banks with USD exposures, it is close to zero for the median bank and slightly negative in the aggregate at -2 per cent of banks’ assets. Moreover, reflecting the asset-liability management practices and the business models of banks with significant USD activity, net exposures are typically relatively unreactive to fluctuations in the exchange rate, policy rates or the business cycle. At the same time, the combined presence of substantial USD-denominated off-balance sheet exposures and volatile funding means that sudden changes in these net exposures cannot be ruled out. An increased probability of such a risk event would then generate pressures on both sides of banks’ balance sheets and potentially downward pressure on on-balance sheet exposures like loans to the real economy.[37] Moreover, the composition of USD liabilities, dominated by funding from financial customers and with a limited share of retail deposits, can exacerbate these pressures by making funding more flight‑prone, thereby increasing vulnerability in a stress scenario.
Chart 10
Earnings outlook in the banking sector and US dollar exposure
Bank ROE forecast revisions by exposure to US exporting borrowers
USD Liquidity Coverage Ratio
(percentage point change relative to January 2025)
(percentage)
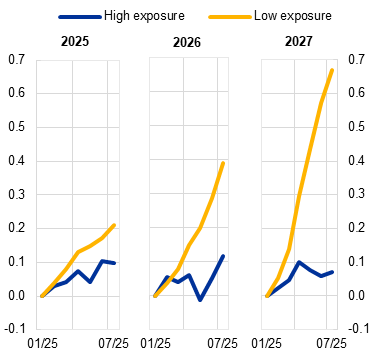
Sources: Left panel: LSEG (I/B/E/S) and ECB calculations; Right panel: ECB Supervisory Reporting and ECB calculations.
Notes: Left panel: forecast revisions are calculated at the bank level for each end-year (fixed event), relative to the January 2025 forecast. Median forecast revisions for each group of banks are taken. High exposure banks are those in the upper quartile of exposure to sector-countries with a high share of exports to the US. Right panel: USD Liquidity Coverage Ratio for a balanced sample of banks.
The latest observations are for July 2025 for the left panel and the second quarter of 2025 for the right panel.
Chart 11
USD assets and USD liabilities of euro area banks
Bank assets denominated in USD
Bank liabilities denominated in USD
(percentages of total assets in the banking system)
(percentages of total assets in the banking system)
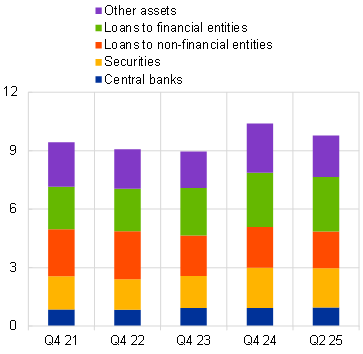
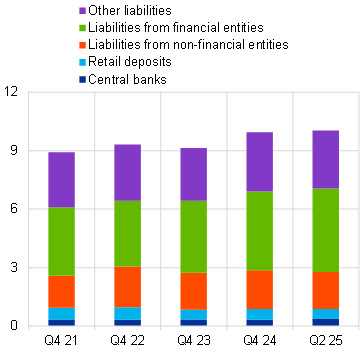
Sources: Both panels: ECB Supervisory Reporting and ECB calculations.
Notes: Left panel: sum of USD assets, converted to EUR at the current exchange rate on each date, across a balance sample of banks that report in NSFR templates, divided by total assets of a balanced sample of banks that report in FINREP. “Other assets” include loans not classified as “Loans to non-financial entities” or as “Loans to financial entities”, and include derivatives exposures and other residual assets, but not off-balance-sheet items. Right panel: Sum of USD liabilities, converted to EUR at the current exchange rate on each date, across a balanced sample of banks that report in NSFR templates, divided by total assets of a balanced sample of banks that report in FINREP. “Other liabilities” include capital instruments and other residual liabilities, as well as derivatives.
The latest observations are for the second quarter of 2025 for both panels.
My aim in this speech has been to showcase some of the analysis that has underpinned our assessment of the strength of monetary transmission in recent monetary policy meetings. In overall terms, monetary policy transmission is progressing smoothly. Yet, within this overall favourable environment, the analysis reported above highlights that it is also important to take into account significant differences across different types of banks, firms and households, across different sectors and across countries.
More generally, the analysis shows that the strength of monetary transmission is time-varying and also depends on the configuration of domestic and external macroeconomic shocks hitting the euro area economy. Accordingly, it makes sense to maintain a meeting-by-meeting and data-dependent approach to assessing the strength of monetary transmission at any given point in time. In turn, this feeds into our overall monetary policy decision making, alongside our other assessment criteria: the inflation outlook and the risks surrounding it, together with the dynamics of underlying inflation.
Continue Reading
-

Longsys Launches Industry’s First Integrated-packaging mSSD, Enabling Flexible and Efficient Manufacturing
SHENZHEN, China, Oct. 21, 2025 /PRNewswire/ — Longsys (301308.SZ) has unveiled the industry’s first integrated-packaging mSSD (Micro SSD), developed under its “Office is Factory” model. By redefining how SSDs are…
Continue Reading
-

Pair of ‘holy’ islands in eerily green African lake hold centuries-old relics and mummified emperors — Earth from space
QUICK FACTS
Where is it? Dek and Daga, Ethiopia [11.907552854, 37.285011102]
What’s in the photo? A pair of islands in the middle of the green-colored Lake Tana
Who took the photo? An unnamed astronaut onboard the International Space Station
When…
Continue Reading
-

The Moon suddenly lights up? Strange flashes and glows still puzzle scientists around the world |
Astronomers have observed odd and strange lights on the Moon, or Transient Lunar Phenomena (TLPs), for centuries. These TLPs vary from bright, short flashes to weak glows and transitory colour changes, drawing the interest of observers across…
Continue Reading
-

ASUS TUF Gaming Unveils Call of Duty: Black Ops 7 Edition AMD Radeon RX 9070 XT | ASUS Pressroom
About ROG
Republic of Gamers (ROG) is an ASUS sub-brand dedicated to creating the world’s best gaming hardware and software. Formed in 2006, ROG offers a complete line of innovative products known for performance and quality, including…
Continue Reading
-

Artificial intelligence and deep learning in breast cancer detection:
Introduction
Breast cancer remains a global health challenge, with over 2.3 million new cases diagnosed annually, underscoring the need for effective early detection and accurate diagnosis methods.1,2 Traditional screening methods, such as…
Continue Reading