The study included 67 participants with an average age of 41.58 years (SD = 16.77). The age of participants ranged from 18 to 69 years, with a median age of 44 years. The interquartile range (IQR) revealed that 25% of the participants were aged 23 years or younger, while 75% were aged 57 years or younger, indicating a wide distribution of age among the participants. The gender distribution revealed that 59.7% of the patients were male (n = 40), while 40.3% were female (n = 27). Regarding the side affected, the majority of the patients had the right side affected, accounting for 53.7% (n = 36), whereas 46.3% (n = 31) had the left side affected. When categorized based on the type of tear, 49.3% of the patients were in the control group (n = 33), 26.9% had a partial tear (n = 18), and 23.9% had a full tear (n = 16) Table 1.
The analysis revealed a strong positive correlation between the Critical Shoulder Angle (CSA) and the presence of RCT (r = 0.827, P < .0001), indicating that higher CSA values were associated with a higher likelihood of RCT. Similarly, the Acromial Index (AI) also showed a significant positive correlation (r = 0.695, P < .0001). Conversely, the Lateral Acromial Angle (LAA) and Acromiohumeral Distance (AHD) were negatively correlated with the presence of RCT (r = − 0.542, P < .0001; r = − 0.413, P = .001) respectively, suggesting that lower values of these parameters were associated with an increased risk of RCT Table 2.
The comparative analysis of shoulder parameters between the Control and Rotator Cuff Tear (RCT) group. For the Critical Shoulder Angle (CSA), the Control group demonstrated a mean value of 31.52 ± 2.14, with a median of 32.00 and a range of 28 to 35. In contrast, the RCT group exhibited a significantly higher mean CSA of 37.12 ± 2.27, with a median of 37.00 and a range of 30 to 43. The Mann–Whitney U test revealed a highly significant difference between the groups (P < 0.001, Z = − 6.717).
Regarding the Lateral Acromial Angle (LAA), the Control group had a mean of 82.82 ± 3.47 and a median of 83.00, with values ranging from 78 to 91. The RCT group, however, had a lower mean LAA of 77.65 ± 4.35, with a median of 78.00 and a range of 70 to 86. This difference was also statistically significant (P < 0.001, Z = − 4.405).
The Acromial Index (AI) was higher in the RCT group, with a mean of 0.702 ± 0.053 and a median of 0.690, compared to the Control group’s mean of 0.617 ± 0.046 and a median of 0.630. The range for AI in the Control group was 0.52 to 0.68, while in the RCT group, it ranged from 0.60 to 0.80. This difference was statistically significant, with a p-value of <0.001 (Z = − 5.644).
Lastly, the Acromiohumeral Distance (AHD) was found to be significantly lower in the RCT group, with a mean of 6.22 ± 1.54 and a median of 6.40, compared to the Control group’s mean of 7.45 ± 1.09 and a median of 7.70. The AHD ranged from 5.00 to 8.90 in the Control group and from 2.50 to 8.60 in the RCT group. The difference between the groups was statistically significant (P = 0.001, Z = − 3.357).
These findings indicate significant variations in shoulder parameters between individuals with rotator cuff tears and those without, suggesting that rotator cuff tears were associated with distinct alterations in anatomical measurements Table 3.
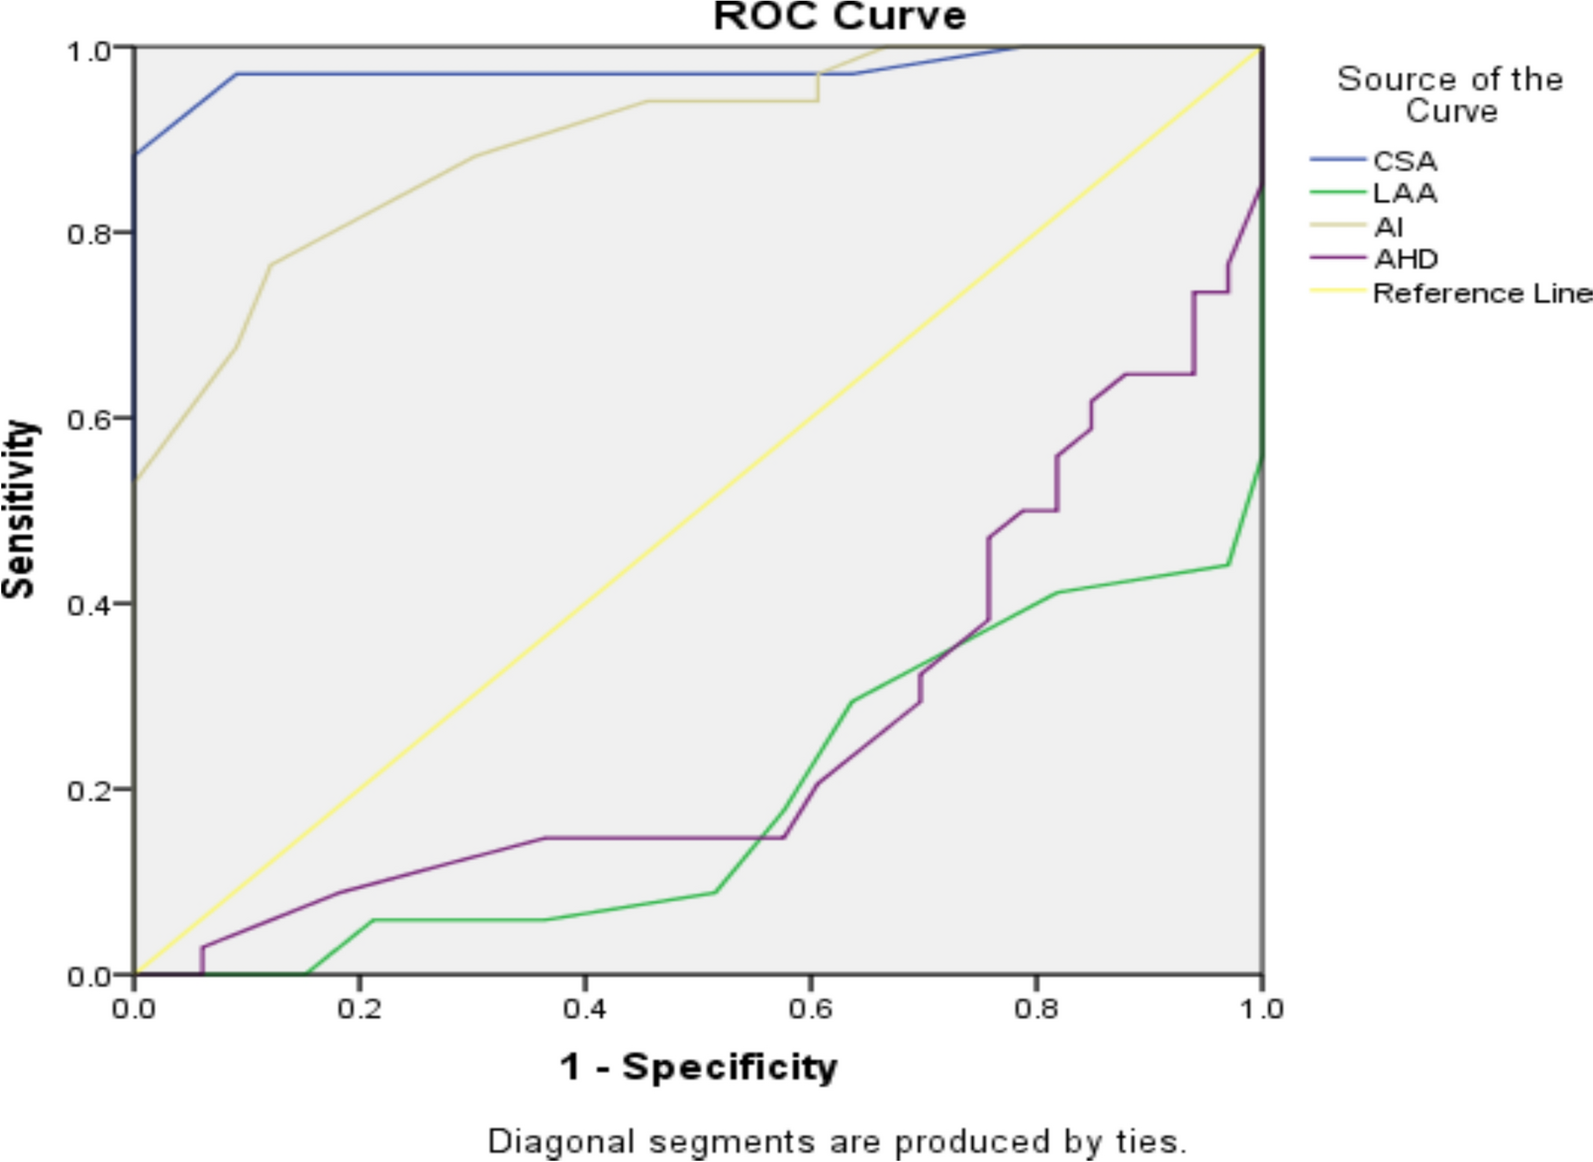
The effectiveness of various shoulder parameters in determining the presence of rotator cuff tears (RCT) was assessed using the Area Under the Curve (AUC) from receiver operating characteristic (ROC) analysis. The Critical Shoulder Angle (CSA) exhibited the highest AUC of 0.975, with a 95% confidence interval (CI) ranging from 0.933 to 1.000, and a standard error (SE) of 0.021. This AUC indicated an exceptional ability of CSA to discriminate between individuals with and without RCT, with the p-value of .000 confirming statistical significance.
Critical shoulder angle (CSA) at 34 degrees: Sensitivity: 0.971 (97.1%): At a cut-off value of 34 degrees, the CSA correctly identified 97.1% of individuals with the condition (true positives). This high sensitivity implied that CSA was highly effective in detecting the condition, minimizing the number of false negatives. Specificity: 0.909 (90.9%): The specificity of 90.9% indicated that the CSA correctly identified 90.9% of individuals without the condition (true negatives). This demonstrated that the CSA had a good ability to correctly exclude those who did not have the condition, reducing false positives.
The Acromial Index (AI) also demonstrated strong discriminative power with an AUC of 0.900 (95% CI 0.829-0.971) and a SE of 0.036. The significance of this parameter is supported by a p-value of 0.000, suggesting it was a highly effective metric for detecting RCT. Acromial Index (AI) at 0.66: Sensitivity: 0.765 (76.5%): At a cut-off of 0.66, AI correctly identified 76.5% of individuals with the condition Specificity: 0.879 (87.9%): The specificity of 87.9% showed that AI effectively identified 87.9% of those without the condition.
In contrast, the Lateral Acromial Angle (LAA) had a markedly lower AUC of 0.188 (95% CI 0.087-0.289) with a SE of 0.052. Despite the statistically significant p-value of .000, this low AUC reflected a poor ability of LAA to differentiate between RCT and control groups, indicating limited utility in clinical settings.
Similarly, the Acromiohumeral Distance (AHD) showed an AUC of 0.262 (95% CI 0.141-0.382) with a SE of 0.061, and a p-value of .001. Although statistically significant, the low AUC suggested that AHD was not a strong predictor of RCT, demonstrating limited effectiveness compared to CSA and AI. Overall, CSA and AI were identified as the most effective parameters for determining the presence of rotator cuff tears, while LAA and AHD were less effective Table 4.
CSA (Critical shoulder angle): The mean CSA for the control group was 31.52 ± 2.14 degrees, with a median of 32.00 (range 28–35). The partial tear group showed a significantly higher mean CSA of 36.33 ± 2.25 degrees and a median of 36.00 (range 30–41). The full tear group had the highest mean CSA at 38.00 ± 2.00 degrees, with a median of 37.50 (range 36–43). The Kruskal–Wallis test revealed a statistically significant difference between groups (P = 0.000, KW = 47.210), indicating that CSA values increased with the severity of rotator cuff tear.
LAA (Lateral acromial angle): The mean LAA for the control group was 82.82 ± 3.47 degrees, with a median of 83.00 (range 78–91). The partial tear group had a lower mean LAA of 77.44 ± 4.23 degrees and a median of 78.00 (range 70–86). The full tear group showed a similar mean LAA of 77.88 ± 4.60 degrees, with a median of 78.50 (range 70–86). The Kruskal–Wallis test indicated a significant difference among groups (P = 0.000, KW = 19.584), suggesting a reduction in LAA with the severity of rotator cuff tear.
AI (Acromial index): The control group had a mean AI of 0.62 ± 0.05, with a median of 0.63 (range 0.52–0.68). The partial tear group showed a higher mean AI of 0.70 ± 0.05 and a median of 0.70 (range 0.61–0.80). The full tear group exhibited the highest mean AI of 0.71 ± 0.06, with a median of 0.69 (range 0.60–0.80). The Kruskal–Wallis test results showed a significant difference (P = 0.000, KW = 31.951), indicating an increase in AI with the severity of the tear.
AHD (Acromiohumeral distance): For the control group, the mean AHD is 7.45 ± 1.09 mm, with a median of 7.70 (range 5.00–8.90). The partial tear group showed a slightly lower mean AHD of 7.19 ± 0.86 mm and a median of 7.15 (range 5.50–8.60). The full tear group had the lowest mean AHD at 5.13 ± 1.41 mm, with a median of 5.10 (range 2.50–8.40). The Kruskal–Wallis test showed a significant difference (P = 0.000, KW = 23.675), suggested a decrease in AHD with increasing severity of the rotator cuff tear. In summary, the analysis using the Kruskal–Wallis test showed significant differences in all four shoulder parameters (CSA, LAA, AI, and AHD) among the different tear size subgroups. Specifically, the CSA and AI values tended to increase with the severity of the tear, while the AHD and LAA decreased. These findings highlighted the impact of tear severity on shoulder parameters Table 5.
CSA (Critical shoulder angle): Control vs Partial tear: The AUC was 0.953 with a 95% confidence interval of 0.876 to 1.000, and a p-value of 0.000. This indicated excellent discriminative ability for CSA in distinguishing between control and partial tear groups. Control versus Full Tear: The AUC was 1.000 with a 95% confidence interval of 1.000 to 1.000, and a p-value of 0.000. This perfect AUC suggests CSA is highly effective in distinguishing between control and full tear groups. Partial vs Full Tear: The AUC is 0.738 with a 95% confidence interval of 0.570 to 0.906, and a p-value of 0.000. This indicates good discriminative ability for CSA in differentiating between partial and full tear groups.
AI (Acromial index): Control vs Partial tear: The AUC was 0.890 with a 95% confidence interval of 0.796 to 0.983, and a p-value of 0.000. This suggested that AI was effective in differentiating between control and partial tear groups. Control vs Full Tear: The AUC was 0.912 with a 95% confidence interval of 0.822 to 1.000, and a p-value of 0.000. This indicated that AI was highly effective in distinguishing between control and full tear groups. Partial vs Full Tear: The AUC was 0.540 with a 95% confidence interval of 0.342 to 0.738, and a p-value of 0.692. This AUC suggested poor discriminative ability of AI in differentiating between partial and full tear groups.
LAA (Lateral acromial angle): Control vs Partial tear: The AUC was 0.166 with a 95% confidence interval of 0.044 to 0.287, and a p-value of 0.000. This very low AUC indicated poor performance of LAA in distinguishing between control and partial tear groups. Control vs Full Tear: The AUC was 0.213 with a 95% confidence interval of 0.072 to 0.354, and a p-value of 0.001. This low AUC suggested that LAA was not effective in distinguishing between control and full tear groups. Partial vs Full Tear: The AUC was 0.538 with a 95% confidence interval of 0.340 to 0.737, and a p-value of 0.704. This AUC suggested poor discriminative ability of LAA in differentiating between partial and full tear groups.
AHD (Acromiohumeral distance): Control vs Partial tear: The AUC was 0.396 with a 95% confidence interval of 0.234 to 0.559, and a p-value of 0.225. This indicated poor discriminative ability of AHD in distinguishing between control and partial tear groups. Control vs Full Tear: The AUC was 0.110 with a 95% confidence interval of 0.000 to 0.221, and a p-value of 0.000. This very low AUC suggested that AHD was not effective in differentiating between control and full tear groups. Partial vs Full Tear: The AUC was 0.085 with a 95% confidence interval of 0.000 to 0.198, and a p-value of 0.000. This very low AUC indicated poor performance of AHD in distinguishing between partial and full tear groups Table 6.