It is prospective study conducted over a two-year period (February 2022 to January 2024) at the Diagnostic and Interventional Radiology Department of our institution. The study was approved by the research ethics committee of the Radiology Department of the Faculty of Medicine Mansoura University (Reference number of approval: MD.22.03.626) and was conducted in accordance with the Declaration of Helsinki. All participants provided written informed consent to participate in this study. Clinical trial number: not applicable. Throughout the study, strict polices were taken to ensure the confidentiality and privacy of patient data.
Thirty-four patients with histologically confirmed EC were enrolled in this study. Participants were included in the study if they were 18 years of age or older and provided written informed consent. All participants had a histologically confirmed diagnosis of endometrial carcinoma. Participants were excluded if they presented with contraindications to MRI (including cochlear implants, cardiac pacemakers, metallic stents, claustrophobia, or morbid obesity), a diagnosis of endometrial stromal sarcoma, or a history of neoadjuvant chemotherapy or radiotherapy.
All participants underwent non-contrast MRI, encompassing DWI and IVIM sequences. Histopathological diagnosis of the neoplastic lesions served as the reference standard for the study’s findings.
Two radiologists with 7 and 14 years of experience, respectively, interpreted the images using a consensus reading approach.
All patients were subject to MRI examinations using a 1.5 Tesla Siemens Symphony scanner with an abdominal coil positioned around the pelvis. Prior to the examination, patients were instructed to Abstain from food and drink for 4–6 h and maintain a comfortably full bladder.
Conventional MRI
MRI imaging T2 Fast-Spin Echo (FSE) Weighted Imaging (TR/TE, 4000–6000/100–110 ms) in two planes: Sagittal and Axial (short axis upon the endometrial cavity), Axial STIR and T1 WI sequences were acquired using a TR of 400–600 ms (ms) and an TE of 10–14 ms. The field of view (FOV) was 38 × 26 cm2, with 5 mm slice thickness, 1 mm interslice gap, and 24 slices acquired.
Diffusion weighted imaging and ADC value
DWI was carried out through a multi-section single-shot spin-echo sequence with b-values of 0, 400 and 800 s/mm2. Diffusion gradients were applied in three orthogonal directions. The imaging parameters were: TR/TE = 7000/77 ms, matrix size = 128 × 128 with same slice thickness, interslice gap, and field of view.
Initial DWI evaluation consisted of interpretation of signal intensity within the endometrial mass. Restricted diffusion was identified by a hyperintense signal on the b-800 image and a corresponding low signal on the ADC map.
ADC maps were automatically produced, followed by manual segmentation of regions of interest (ROIs) on areas of maximum restriction of tumoral tissue with careful exclusion of areas showing necrosis, cystic changes, or hemorrhage. Necrotic areas were avoided during ROI placement by using the anatomical images as a guide. ROI sizes ranged from 1 to 2.5 cm2. The final parametric values were derived from the mean measurements across all ROIs. The inter-reader agreement between the two radiologists was substantial (Cohen’s κ = 0.82, p < 0.001).
Intravoxel incoherent motion
Ten-b-value DWI sequence was acquired including (0, 30, 70, 100, 200, 400, 800, 1000, 1500, and 2000 mm2/s).
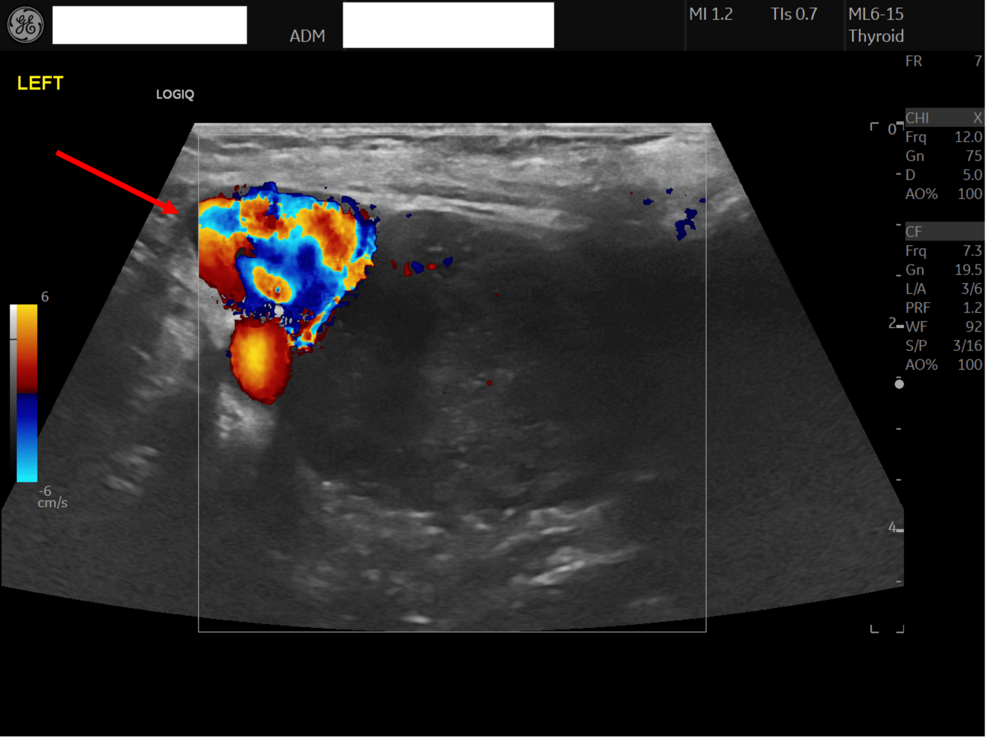
Regions of interest (ROIs) were consistently delineated on ADC maps and then applied to the equivalent IVIM maps. A biexponential model was used to calculate D, D*, and f. Color maps were generated from the IVIM model and were overlaid on anatomical reference images, with a continuous color scale ranging from low values (blue) to high values (red). D represents the true diffusivity of water molecules within the extracellular space, reflecting tissue microstructure; the color bar on the side indicates the D values, where blue represents lower diffusivity and red represents higher diffusivity. D* reflects the motion of blood water within the capillary network. The perfusion fraction (f) quantifies the proportion of tissue occupied by perfused blood Color maps of the perfusion fraction (f, %) were generated from the IVIM biexponential fitting model. These maps display the fractional volume of microvascular blood flow within each voxel. A continuous color scale was applied, with blue representing low f values and red representing high f values, as indicated by the accompanying scale bar. ROIs were drawn over the solid portion of the tumor on the f maps, referencing anatomical images to avoid necrotic or cystic regions, and mean values were recorded for statistical analysis.”
Histopathological analysis
Twenty-seven cases were candidates for total abdominal hysterectomy and bilateral salpingo-oophrectomy underwent full post-surgical histopathological analysis to determine tumor type, However the other seven cases were shifted to chemoradiotherapy following D and C only for the extensive spread of the disease beyond the pelvic cavity (four case) or due to the age and general condition of the patient (three cases).
Statistical analysis
Data were analyzed using SPSS version 15 for Windows®. Frequencies and percentages described categorical variables, with group comparisons performed using Chi-square tests. Quantitative data normality was assessed via the Kolmogorov–Smirnov test. Normally distributed data are reported as means ± standard deviations, while non-normally distributed data are presented as medians and ranges (minimum–maximum). The Mann–Whitney U test was employed for non-parametric group comparisons. A p-value < 0.05 was considered statistically significant.