The DCCT/EDIC study has been previously described in detail [14, 15] Briefly, between 1983 and 1989, the DCCT randomly assigned 1,441 participants with T1D (age range, 13–39 years) without any history of CVD, hypertension, hyperlipidemia, or neuropathy requiring medical intervention to intensive or conventional diabetes therapy to evaluate the effects of glycemia on the development and progression of diabetes-related complications [14]. Two parallel cohorts were recruited: a primary prevention cohort (with 1–5 years’ diabetes duration, no retinopathy, and urine albumin excretion rate [AER] < 40 mg/24 h) and a secondary intervention cohort (1–15 years’ duration, mild-to-moderate non-proliferative diabetic retinopathy, and AER ≤ 200 mg/24 h). After a mean (range) of 6.5 (3–9) years of follow-up, intensive therapy markedly reduced the development and progression of complications. This included CAN, defined during DCCT by CARTs as either an R-R variation during deep breathing < 15 or an R-R variation 15–19.9 in combination with a Valsalva ratio ≤ 1.5 or a decrease of > 10 mmHg in diastolic blood pressure upon and while standing for 10 min [3,4,5]. At the end of the DCCT, all participants were encouraged to adopt intensive therapy and transitioned to their health care practitioners for ongoing diabetes care. In 1994, 96% of the surviving DCCT cohort enrolled in the EDIC observational study [15]. The present analyses included 997 participants (82% of the actively participating cohort) with ECG-derived CAN data available at EDIC year 22 (2015) and follow-up data collected through EDIC year 29 (2022).
Electrocardiography
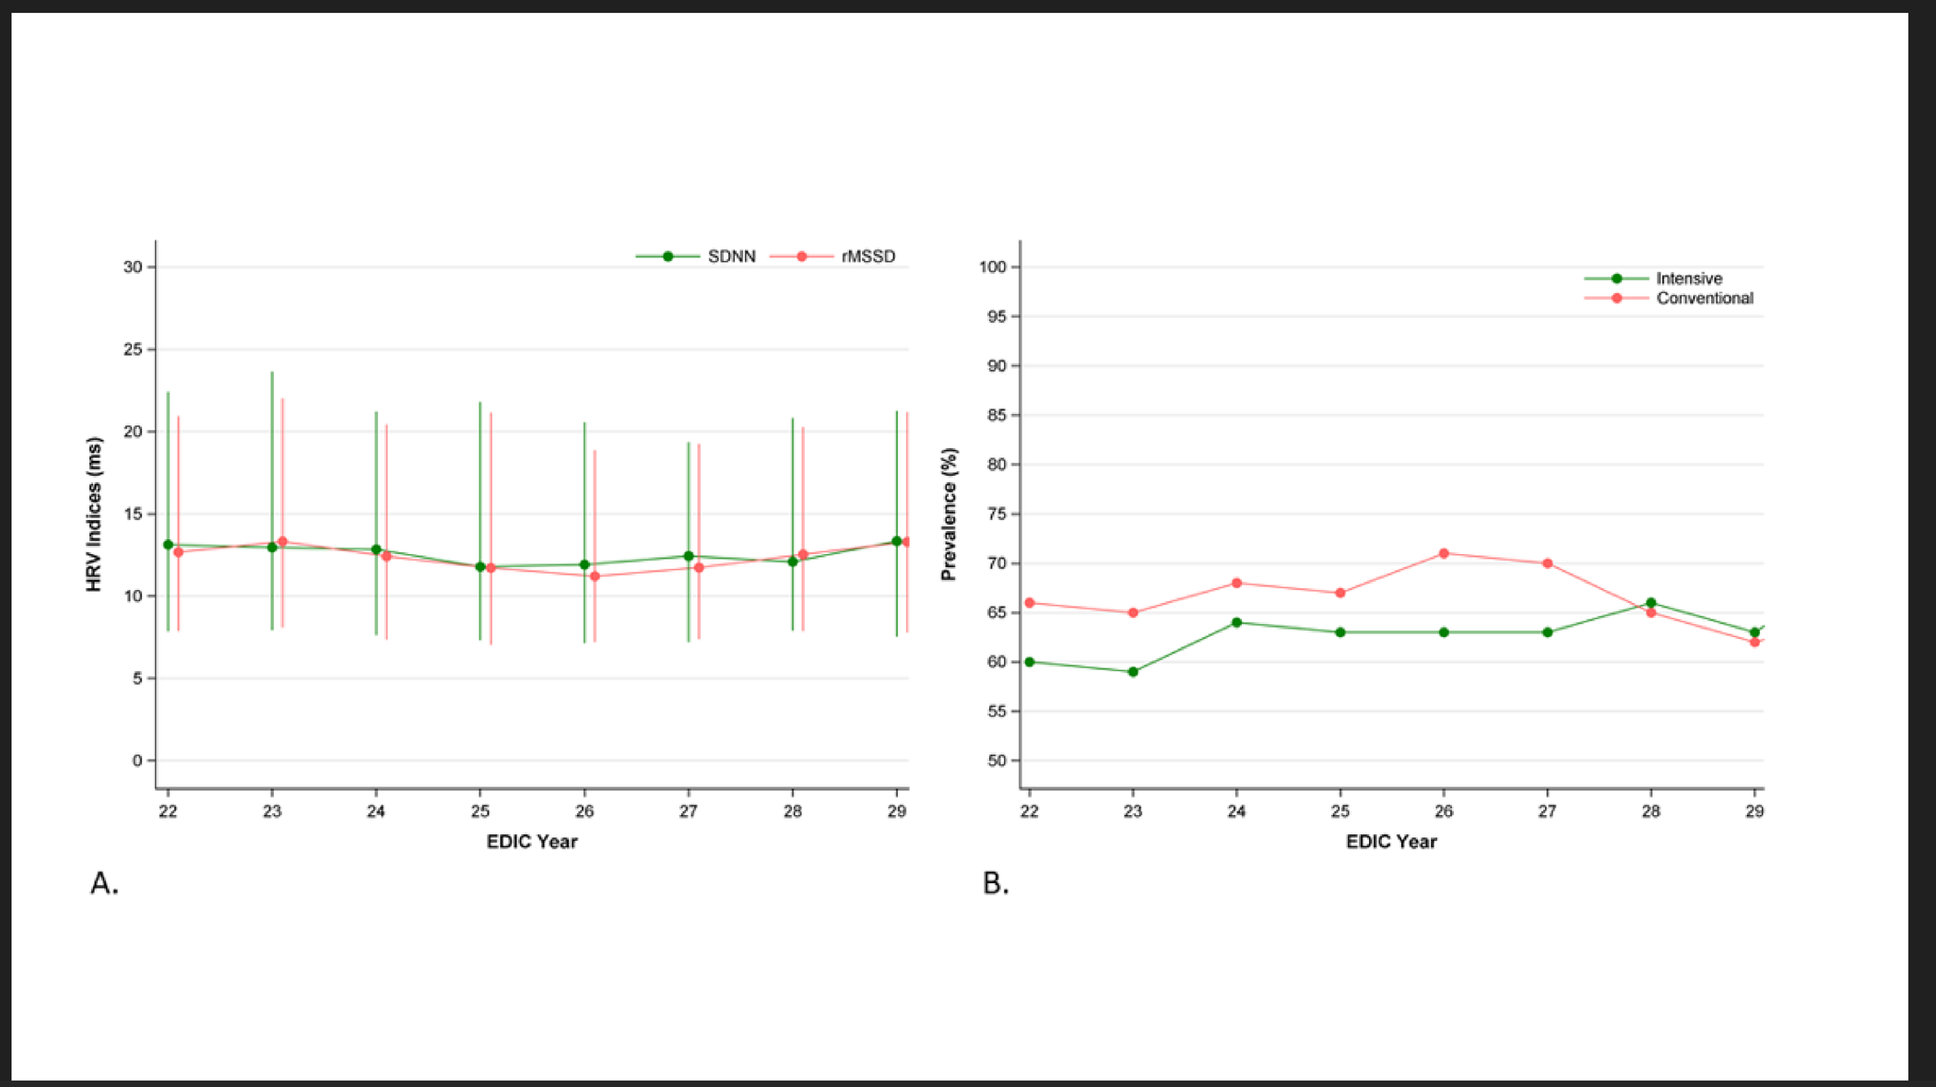
Standard 10-second, 12-lead ECGs were obtained annually during EDIC with the participant at rest in the supine position [16]. In 2014–2015, the former analog paper-based ECG recordings were replaced with digital recordings using GE MAC 1200 electrocardiographs (GE, Milwaukee, WI, USA). Digital ECGs were processed centrally at the Epidemiological Cardiology Research (EPICARE) Center at Wake Forest School of Medicine (Winston-Salem, NC). ECGs with arrhythmias, conduction defects, and more than 50% ectopic beats were excluded following recommended standards [17]. Two HRV indices that reflect parasympathetic nervous system activity were derived: standard deviation of normally conducted R-R intervals (SDNN), and root mean square of successive differences between normal-to-normal R-R intervals (rMSSD). Based on a previous validation study in this cohort using gold-standard CARTs, ECG-derived CAN was defined as SDNN < 17.13 and rMSSD < 24.94 ms [13].
Candidate risk factors
Using standardized methods, risk factors were assessed quarterly during DCCT and annually during EDIC [14, 15]. Assessments included demographic and behavioral risk factors and medical outcomes, and measurements of height, weight, blood pressure, and pulse rate. Insulin doses were self-reported and expressed as the average total daily dose in units per kilogram of body weight. Hypertension was defined as systolic blood pressure ≥ 140 mmHg, diastolic blood pressure ≥ 90 mmHg, documented history of hypertension, or use of antihypertensive medications and hyperlipidemia as LDL cholesterol ≥ 130 mg/dL or use of lipid-lowering medications. Self-reported medication usage was collected during EDIC but not during the DCCT.
HbA1c was measured centrally by high-performance liquid chromatography and a cumulative measure was derived using the time-weighted mean of all follow-up values from DCCT baseline up to the ECG study visit. Fasting lipids and AER were measured annually during DCCT and on alternate years during EDIC. LDL cholesterol was calculated using the Friedewald equation [18]. AER was measured from 4-h urine samples with fluoroimmunoassay from DCCT baseline to EDIC year 18 (2012) and subsequently from spot urine samples and estimated as urine albumin/creatinine concentrations [19]. Estimated glomerular filtration rates (eGFR) were calculated from serum creatinine measured annually using the Chronic Kidney Disease Epidemiology Collaboration equation [20]. Severe hypoglycemia was self-reported and defined as the cumulative number of events leading to coma or seizure within the 3 months prior to each DCCT/EDIC visit. The presence of kidney disease, proliferative diabetic retinopathy, neurologic complications, and cardiovascular disease were determined and defined as previously described [5, 21,22,23].
Cardiovascular outcomes
Any-CVD was defined as the time to the first occurrence of any of the following events between EDIC years 22–29 (2015–2022): cardiovascular death; non-fatal myocardial infarction (MI); non-fatal stroke; subclinical MI detected on an annual ECG; angina confirmed by ischemic changes with exercise tolerance testing or by clinically significant obstruction on coronary angiography; congestive heart failure (paroxysmal nocturnal dyspnea, orthopnea or marked limitation of physical activity caused by heart disease); or revascularization (with angioplasty and/or coronary artery bypass) [23]. The secondary CVD outcome, major atherosclerotic cardiovascular events (MACE), a subset of any-CVD, included only the time to the first occurrence of cardiovascular death, non-fatal MI, or non-fatal stroke.
Statistical analyses
Candidate risk factors were grouped into 10 blocks as previously described: design, physical, behavioral, blood pressure, medications, lipids, diabetes-related kidney disease, hypoglycemia, and glycemia [5]. Generalized estimating equation (GEE) models were used to evaluate the association of ECG-derived CAN with individual risk factors over repeated time points. A comprehensive multivariable GEE regression model was evaluated using similar model-building techniques previously described [5, 23] Given the large number of risk factors, variables were entered into the GEE model one block at a time in the order displayed in Supplementary Table 1. After each block was added, a variable was deleted if it was not nominally significant (p < 0.10). After the last block was entered, the final multivariable model was fit using the selected covariates, and variables significant at p < 0.05 were retained. Risk factors were included as fixed (e.g., sex), or time-dependent (e.g. HbA1c) covariates representing the baseline (EDIC year 22), current (most recent), or time-weighted mean of all follow-up values since DCCT randomization, weighting each value by the time interval between measurements. Categorical time-dependent covariates were defined as any prior report up to each visit. Highly collinear variables were evaluated separately (e.g., weight and BMI); only one was entered into the model. Odds ratios (ORs) and unsigned covariate z-test values are presented, the latter to differentiate covariate effects with p < 0.0001 (two-sided).
Kaplan-Meier estimates were used to describe the cumulative incidence of the first occurrence of any-CVD and of MACE between EDIC years 22–29 (2015–2022), by ECG-derived CAN status at EDIC year 22. Cox proportional hazards regression models were used to estimate the effect of ECG-derived CAN status at EDIC year 22 on subsequent CVD risk (CVD events occurring after EDIC year 22), unadjusted and adjusted for age and HbA1c. In addition, we included ECG-derived CAN, as a time-dependent covariate, into the final multivariable model previously published for any-CVD and MACE [23] to evaluate its independent association. In this model, ECG-derived CAN measurements were available since EDIC year 22, performed at 1-year intervals until EDIC year 29. Adjustments were made for risk factors previously identified in the DCCT/EDIC cohort.
Given the exploratory nature of our analyses, results were not adjusted for multiple testing, and associations with p < 0.05 were considered statistically significant. All analyses were performed using SAS statistical software version 9.4 (SAS Institute).