Study population
This study was a cross-sectional study based on a registered household population aged 65 years or older who underwent a physical examination from January 1, 2021, to December 31, 2021, in Xiamen, Fujian Province, China. Subjects aged ≥ 65 years in the community were informed whether to participate in the physical examination voluntarily. We included 228,664 older adults who completed the survey. Subjects with hepatic steatosis via abdominal ultrasonography (HD-15; Philips, Netherlands); presence of ≥ 1 metabolic risk factor: 1) Body mass index (BMI) ≥ 25 kg/m2 or waist circumference (WC) > 94 cm (males) and > 80 cm (females); 2) Fasting blood glucose ≥ 5.6 mmol/L or hemoglobin A1c ≥ 5.7% or a previous diagnosis of diabetes or treatment for diabetes; 3) Blood pressure ≥ 130/85 mmHg or treatment for hypertension; 4) Triglyceride (TG) ≥ 1.7 mmol/L or lipid-lowering therapy; 5) High-density lipoprotein cholesterol (HDL) ≤ 1 mmol/L (males) or ≤ 1.3 mmol/L (females) or lipid-lowering therapy; and without treatment for hepatitis B or without significant alcohol consumption (alcohol consumption of ≥ 30 g ethanol/day in men and ≥ 20 g ethanol/day in women20) were diagnosed as MASLD1.
To investigate the association between APs and liver fibrosis in MASLD, the following exclusion criteria were applied: (1) subjects without ultrasound examination (n = 94,276); (2) subjects with liver cirrhosis detected by ultrasound (n = 62); (3) subjects without valid APs exposure values due to incomplete address information (n = 46,005); (4) non-MASLD (n = 64,434). Finally, 23,887 MASLD subjects were enrolled.
We performed this study according to the tenets of the Declaration of Helsinki. This work was part of the routine procedure of Health Management Services for the elderly in the national basic public health services in China21. Written informed consent was obtained from all participants. The study protocol was approved by the Ethics Committee of Xiamen Center for Disease Control and Prevention [ID: XJK/LLSC (2024) 016]. All the data analyzed was anonymized.
Assessment of covariates
In all subjects, a standardized questionnaire survey was conducted to collect sociodemographic characteristics, lifestyle factors (smoking, alcohol intake, and physical activity), and medication history; medical examinations included height, weight, WC, blood pressure, blood biochemistry, hemoglobin A1c, and abdominal ultrasonography. The indicators of blood biochemistry, including fasting blood glucose, TG, total cholesterol (TC), low-density lipoprotein cholesterol (LDL), HDL, alanine transaminase (ALT), aspartate transaminase (AST), and platelet count of each subject, were evaluated using an auto-analyzer (AU5800; Beckman, California, USA).
Subjects who smoked at least 1 cigarette per day with continuous smoking for more than 6 months were defined as current smokers. Daily alcohol consumption was calculated as the volume of alcohol consumed per day (g) × alcohol concentration (%) × 0.822. Subjects with alcohol consumption > 0 g ethanol/day were defined as drinkers. The self-reported physical activity frequency was classified as inactive, occasional, often (> 1 time/week), and daily. BMI was calculated as weight divided by the square of height (kg/m2). WC was measured at the midpoint between the lower border of the rib cage and iliac crest, and central obesity was defined as a waist circumference ≥ 90 cm in men and ≥ 85 cm in women23. Hypertension was defined as systolic blood pressure of ≥ 140 mm Hg and/or diastolic blood pressure of ≥ 90 mm Hg and/or a history of antihypertensive medication and/or a self-reported history of hypertension. Diabetes was defined as a fasting blood glucose concentration ≥ 7.0 mmol/L, and/or a history of antidiabetic medication, and/or a self-reported history of diabetes.
Exposure assessment
The exposure data of O3, PM2.5, and PM10 (spatial resolution 1 km × 1 km) were obtained from China high air pollutants (CHAP) dataset. The concentration data of sulfur dioxide (SO2), carbon monoxide (CO), and NO2 (spatial resolution 15 km × 15 km) were sourced from a high-resolution air quality reanalysis dataset over China (CAQRA) dataset. Different sources of pollutants, such as traffic, industrial emissions, and domestic heating, were considered in these databases. Participants’ residential addresses were converted into geographic coordinates using the Baidu Map API (https://lbsyun.baidu.com/) and subsequently integrated into the CHAP and CAQRA datasets using the k-nearest neighbor algorithm for spatial analysis. Daily exposure levels of PM2.5, PM10, O3, SO2, CO, and NO2 were matched to each participant based on their geographic location. The average exposures over 1-year and 2-year periods were computed, with these periods being defined as exactly 1-year and 2-year preceding the date of the medical examinations, respectively. Two-year average levels of AP were considered as the exposure variable in the main analyses.
Diagnosis of liver fibrosis
Liver fibrosis in patients with MASLD was evaluated by metabolic dysfunction-associated fibrosis 5 (MAF-5)24 and Fibrosis-4 index (FIB-4)25. The MAF-5 score is a newly validated, age-independent referral tool to identify individuals at high risk of liver fibrosis with a relevant improvement of fibrosis case-finding in older populations. MAF-5 was calculated as follows: -11.3674 + WC (cm) × 0.0282 – BMI (kg/m2) × 0.1761 + WC (cm) × BMI (kg/m2) × 0.0019 + 2.0762 for diabetes (yes = 1, no = 0) + ln [AST (U/L)] × 2.9207 – platelet count (109/L) × 0.0059. A MAF-5 score of < 0, 0–1, and ≥ 1 was considered a strong predictor of low, medium, and high liver fibrosis risk, respectively. FIB-4 was calculated as follows: age (years) × AST (U/L)/ [platelet count (109/L) × ALT (U/L)1/2]. A low FIB-4 score of < 2 was considered a strong predictor of the absence of liver fibrosis in the elderly.
Statistical analyses
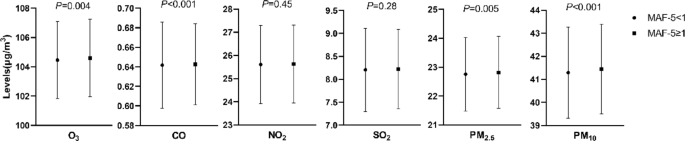
We described and compared the characteristics of MASLD subjects with low to medium liver fibrosis risk (MAF-5 < 1) and high liver fibrosis risk (MAF-5 ≥ 1). If following normal distribution, continuous variables were presented as mean ± standard deviation and compared by t-test. If not, they were presented as medians (interquartile range) and compared by the Mann–Whitney U test. Categorical variables were presented as numbers (%) and compared by the Pearson chi-square test or the Fisher exact probability test. We used restricted cubic splines with three knots to explore the dose–response relationship between APs and liver fibrosis in MASLD. Then, we divided all the participants into quartiles according to AP concentration. Using the lowest quartile group as the reference, we conducted unadjusted-, age-, sex-adjusted, and multivariate-adjusted (further adjusted for BMI, ALT, hypertension, diabetes, central obesity, physical activity, smoking, and alcohol drinking status) logistic regression models to estimate the odds ratios (ORs) and 95% confidence intervals (CIs) for liver fibrosis risk in the higher quartile groups.
To better understand the overall effect of the mixture of APs, we assessed the combined effect of the AP mixture on liver fibrosis using a quantile g-computation model based on the R qgcomp package26. This model was used to estimate the change in liver fibrosis risk for a synchronous one-quartile increase for all APs. The plot depicts APs and liver fibrosis prediction at the joint exposure levels via quantile g-computation and bootstrap variance with a bootstrap of up to 1000. The model was adjusted for age, sex, BMI, ALT, hypertension, diabetes, central obesity, physical activity, smoking, and alcohol drinking status.
We conducted a stratified analysis to test the potential interaction between sex, age, BMI, central obesity, diabetes, hypertension, alcohol consumption, smoking status, physical activity, and APs in liver fibrosis development in MASLD. To validate the robustness of the results, five sensitivity analyses were performed: (1) applying two-pollutant models to assess the confounding effects of co-occurring pollutants; (2) using additional noninvasive indices, i.e., FIB-4, as diagnosis criteria of liver fibrosis; (3) using a 1-year average of APs to assess long-term exposure; (4) excluding participants with medium risk of liver fibrosis (MAF-5 of 0–1); (5) calculating E-value to assess the robustness of our findings to unmeasured confounding27. The E-value quantifies the minimum strength of association that an unmeasured confounder would need to have with both the exposure and outcome to explain away the observed association.
All data were analyzed using SAS software, version 9.4 (SAS Institute, Cary, NC), and R software, version 4.4.0, with two-sided tests and P < 0.05 as statistically significant.