Ethical consideration
At the beginning of the study, an informed consent form was obtained from all participants. Proficient patients provided written consent by reading and signing informed consent forms, while illiterate patients gave verbal consent. The study received ethical approval from the Sirjan School of Medical Sciences’ ethical committee (approval number: IR.SIRUMS.REC.1402.011).
Study design and participants
Our study adheres to the rigorous standards set forth by the Strengthening the Reporting of Observational Studies in Epidemiology (STROBE) Statement. This includes a structured approach to the design and a thorough adherence to the established guidelines for the reporting of observational studies25.
In this case-control study, which was based on hospital records, 155 female patients with breast cancer (newly diagnosed without receiving specific treatment and without changes in diet) were selected with histopathological confirmation by a physician26 using convenience sampling. The patient group was recruited from the Javad Al-Aemeh clinic in Kerman, Iran, from September 2021 to March 2023, according to the bellow inclusion criteria. The control group consisted of 155 apparently healthy women who were selected from the same clinic but from different departments of the same hospital. Women in the control group were considered cancer-free if they verbally confirmed they had no current cancer or history of cancer (no confirmatory exam or test was required). The control group’s health status was assessed based on self-reported medical histories and screening for non-neoplastic diseases, including orthopedic disorders, disc disorders, and eye, nose, ear, or skin disorders. Control participants were frequency-matched to cases by 5-year age-group.
The inclusion criteria for the case group included women aged 18–70 years, breast cancer diagnosis confirmed by histopathology, willingness to participate in the study, and newly diagnosed patients who had not received any special treatment at the time of recruitment. The inclusion criteria for the control group were similar: women aged 18–70 years with no history of breast cancer or any other cancer, and a willingness to participate in the study. Additionally, the exclusion criteria for both groups included individuals with heart, kidney, liver diseases, autoimmune diseases, diabetes, those following special diets such as vegetarianism, pregnant and breastfeeding individuals, those with any kind of mental and social disorder or shock, energy intake of less than 800 kcal or more than 5000 kcal, and those who had consumed anti-inflammatory drugs and antioxidant supplements in the past six months.
A general information questionnaire was also completed by the researcher, which included details such as age, drug history, education, employment status, marital status, smoking habits, alcohol consumption, physical activity, anthropometric indices, age at the onset of menstruation, age at menopause, pregnancy history, number of pregnancies, number of children, number of abortions, breastfeeding history, duration of breastfeeding, history of contraceptive pill usage, and family cancer history. The amount of physical activity was calculated by the International Physical Activity Questionnaire (IPAQ). The IPAQ consists of 7 questions and includes three parts: heavy activity with a coefficient of 8, moderate activity with a coefficient of 4, and walking with a coefficient of 3.3. The score for each part is calculated separately and, finally, the numbers are added together. A range between 0 and 600 min per week is considered light activity, 600 to 3000 min per week as moderate activity, and more than 3000 min per week as heavy activity. To obtain a score, the patient must be active for at least 10 min. The validity and reliability of this questionnaire have been confirmed (r = 0.7)27. The values of anthropometric indices were recorded by a nutrition expert. For anthropometric evaluations, height was measured using a wall-mounted height meter accurate to 0.5 cm (without shoes, heels against the wall, knees straight, looking forward, and shoulders in a normal position). The patients’ weight was measured with minimal clothing and without shoes using a Seca digital scale accurate to 0.5 kg. Waist circumference was measured at the top of the iliac crest and below the navel using a tape measure accurate to 0.5 cm. Additionally, the body mass index (BMI) was calculated by dividing the weight (in kilograms) by the square of the height (in meters).
Measurement of pathobiological markers
In the present study, the Ki-67 marker was measured based on mastectomy specimens using immunohistochemistry (IHC) by a pathologist. The ultrasound was used to measure tumor size. The grade of tumor was determined by a pathology test.
Dietary intake assessment and calculation of DAI score
In this study, information related to the participants’ food intake over the past year was collected through a 168-item Food Frequency Questionnaire (FFQ) by a trained nutritionist28. Subsequently, the reported values for each food item were converted to grams per day using the Iranian Home Scale Guide and analyzed with Nutritionist IV (NUT4) software. Consequently, the amounts of energy, macronutrients, and micronutrients consumed by each individual were determined by this software.
To calculate the DAI score, six nutrients with antioxidant properties including magnesium, selenium, zinc, vitamin A, vitamin C, and vitamin E were used. The method recommended by Benzie was employed to measure the DAI score According to the formula provided below, to calculate an individual’s DAI score, the mean intake of each of the six nutrients consumed by the individual was subtracted from the global mean intake and then divided by the global standard deviation. The resulting scores were then summed to determine the overall DAI score for each individual21.
$${text{DAI}};{text{score}}=sumlimits_{{i=1}}^{6} {left( {frac{{{text{Mean}};{text{intake}};{text{of}};{text{nutrien}}{{text{t}}_i} – {text{Global}};{text{mean}};{text{intake}};{text{of}};{text{nutrien}}{{text{t}}_i}}}{{{text{Global}};{text{standard}};{text{deviation}};{text{of}};{text{nutrien}}{{text{t}}_i}}}} right)}$$
Sample size
In this research, using the study of Pinar et al.29 and considering DAI score as the main variable, the sample size was calculated with a 15% loss of 155 individuals for each group.
$${text{Sample}};{text{size}}=frac{{left( {r+1} right) times S{D^2} times {{left( {{Z_beta }+{Z_{alpha /2}}} right)}^2}}}{{r times {d^2}}}$$
In this formula, r is the ratio of controls to cases in the study. SD is the standard deviation of the outcome measure. Z_beta is the Z-score corresponding to the desired power of the study. Also, Z a/2 is the Z-score corresponding to the desired level of significance. And finally, d is the desired precision or effect size.
Data analysis
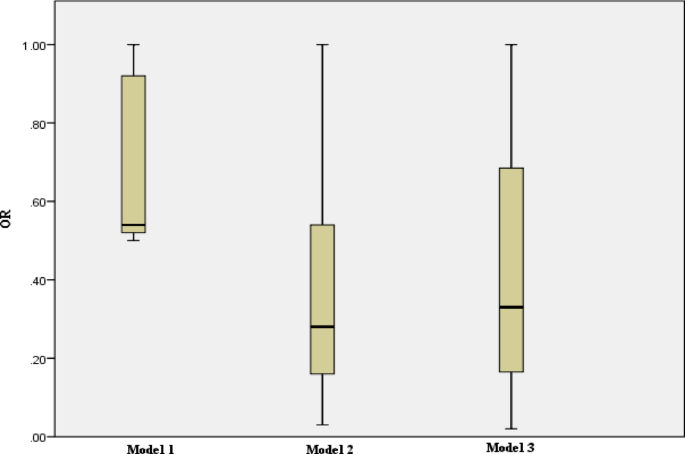
All data are reported as mean ± standard deviation (SD) for quantitative data and frequency (percentage) for qualitative data. The normality of the data was checked using the Kolmogorov-Smirnov test. Dependent variables were divided into quartiles based on the DAI score, and the differences between the quartiles were evaluated using one-way analysis of variance (ANOVA) for quantitative variables (with LSD post hoc) and the chi-square test for categorical variables. The comparison of quantitative results between case and control groups was performed using the independent samples t-test. Similarly, the chi-square test was used to compare qualitative variables between the case and control groups. The one-sample t-test was used to compare the food intake of individuals with the mean global consumption in the two groups. Linear regression, along with modeling by adjusting for confounding factors (model 1; without adjustment, model 2; adjustment for energy, and model 3 (stepwise); with correction for age, PA, marital status, education, pregnancy status, history of breastfeeding, family history of cancer, alcoholic beverages status, estrogen receptor (ER) expression, and human epidermal growth factor receptor2 (HER2) expression was used to determine the relationship between the DAI (independent variable) and tumor size and Ki-67 marker (dependent variables) in case group. The correlation between two quantitative variables (tumor size and Ki-67 marker) was assessed using the Pearson correlation test. Additionally, the odds of breast cancer (95% CI) according to DAI quartiles compared to the reference (OR = 1) were measured using logistic regression, with adjustment of confounding factors (model 1; unadjusted, model 2; adjusted for energy, and model 3; adjustment for energy, age, BMI, PA, marital status, status of menopause, number of pregnancies, number of abortion, duration of breastfeeding, education, employment, history of taking contraceptive pills, family history of cancer, smoking status, and alcoholic beverages status). Also, in the pre and post menopause status, the odds of breast cancer (95% CI) according to DAI quartiles compared to the reference (OR = 1) were measured using logistic regression, with adjustment of confounding factors (model 1; unadjusted, model 2; adjusted for energy, and model 3 (backward); adjustment for age, education, pregnancy status, number of pregnancies, number of children, lactation years, alcoholic beverages, history of contraceptive use, family history of cancer, and age of first menstruation). In this study, a p-trend was calculated for each model to compare the ORs associated with quartiles in each model. SPSS software version 23 (IBM SPSS Statistics, Armonk, USA) was used for data analysis. A p-value of less than 0.05 was considered statistically significant.