Subjects’ age and body mass index were (mean ± SD, range) (31 ± 8, 19–44 years) and (28 ± 8, 20–40, kg/m2). The proportion of the different types of muscle fibers in the total of 170 muscle fibers phenotyped for each subject, ranked from most to least dominant were as follows (mean ± SD, range): Type I (0.37 ± 0.20, 0.12–0.63), Type IIa (0.34 ± 0.14, 0.11–0.50), Type IIa/IIx (0.17 ± 0.10, 0.03–0.35), Type I/IIa (0.06 ± 0.08, 0.00–0.24), and Type IIx (0.03 ± 0.04, 0.00–0.12).
The datasets generated from the resampling process, which described the proportion of muscle fiber types using 25, 50, or 100 fibers, were not normally distributed for any subject in either the Ordered Selection Fiber Typing or the Random Selection Fiber Typing data. Consequently, all data from the resampling process were analyzed using quartiles (median, 25th, and 75th percentiles).
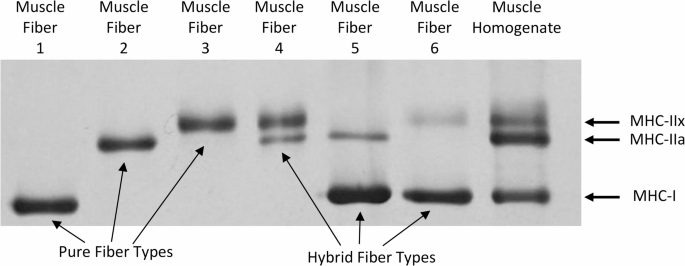
Fiber type determination based on ordered and random selection of a given number of phenotyped muscle fibers
Table 1 presents the median, 25th, and 75th percentile values describing the proportions of the different types of muscle fibers for each study participant. These values were derived from the Ordered and Random selection of phenotyped muscle fibers, and when resampling 25, 50, and 100 muscle fibers. The values describing the proportion of muscle fiber types based on the Ordered selection fiber typing analysis were statistically significantly different across the counts of muscle fibers analyzed (i.e., 25, 50 and 100) for all muscle fiber types and in all subjects (P < 0.05). However, except for the least represented fiber types in muscle (i.e., Type I/IIa, Type IIx), these values were not statistically significantly different across the counts of muscle fibers analyzed (i.e., 25, 50 and 100) based on the Random selection fiber typing analysis (P > 0.05). This is further illustrated in Fig. 2, which shows violin plots for the most abundant (i.e., Type I; top) and least abundant (i.e., Type I/IIa; bottom) fiber types in muscle, based on the Ordered and Random selection analyses for fiber typing.
Estimates of muscle fiber type proportions based on resampling different numbers of phenotyped fibers isolated in either an ordered or random fashion from the muscle biopsy sample. Violin plots depicting the distributions of the median, 25th, and 75th percentiles of the proportions of Type I (top) and Type I/IIa (bottom) muscle fibers for a single subject when resampling (i.e., 1000 times) 25, 50, and 100 phenotyped fibers isolated in Ordered or Random fashion from the muscle biopsy. Dunn’s test was used for pairwise comparisons. P values between the different muscle fiber counts are as shown. Note: N/A, no muscle fibers of this type were detected in the first 25 fibers isolated from the muscle biopsy sample.
Frequency distribution of fiber type estimates based on ordered and random selection of a given number of phenotyped muscle fibers
We plotted the frequency of the distribution of the median describing the proportion of muscle fiber types for a single subject generated from the Ordered and Random selection of the muscle fibers phenotyped and for the most abundant (i.e., Type I) and least abundant (i.e., Type I/IIa) fiber types in muscle (Fig. 3). These histograms show that the width of the distribution of the muscle fiber type estimates is becoming narrower as the count of muscle fibers analyzed increases for both the Ordered and Random selection fiber typing approaches. Also, the central tendencies for the Ordered and Random selection fiber typing approaches are closest at the highest number of muscle fiber count (i.e., 100 muscle fibers) for both the most and least abundant fibers in muscle. Moreover, the estimates describing the proportion of fiber types in muscle exhibit a greater clustering away from the central tendency (i.e., true value) at the lowest counts of muscle fibers (i.e., 25 muscle fibers compared to 100 muscle fibers), and this is especially evident for the least abundant muscle fiber types (Fig. 3B).
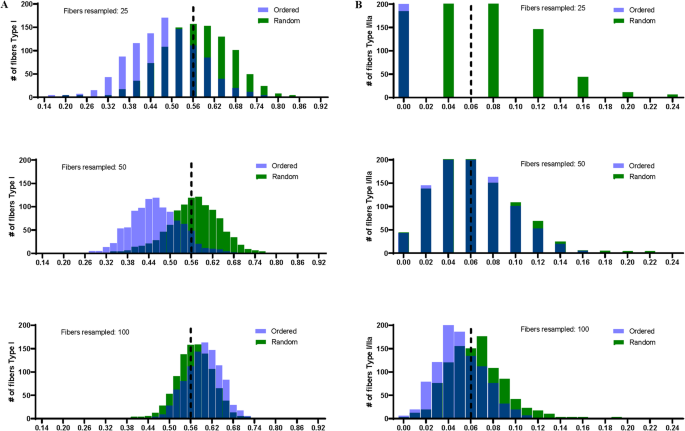
Frequency of the distribution of the median describing the proportion of different types of fibers in skeletal muscle when using ordered and random selection for phenotyping isolated muscle fibers. Histograms showing the frequency of the distribution of the median describing the proportion of Type I (A) and Type I/IIa (B) muscle fibers in skeletal muscle for a single subject when resampling (i.e., 1000 times) 25, 50, and 100 muscle fibers using Ordered and Random selection for phenotyping fibers isolated from a muscle biopsy sample.
Agreement of ordered and random muscle fiber phenotyped with observed muscle fiber phenotype
We constructed Bland-Altman plots to evaluate the agreement of the estimated proportions of the various muscle fiber types generated from the Ordered and Random selection fiber typing analyses with the corresponding observed proportions based on all 170 muscle fibers analyzed. Representative plots for the most abundant (i.e., Type I; Fig. 4A) and least abundant (i.e., Type I/IIa; Fig. 4B) fiber types in muscle are shown in Fig. 4.
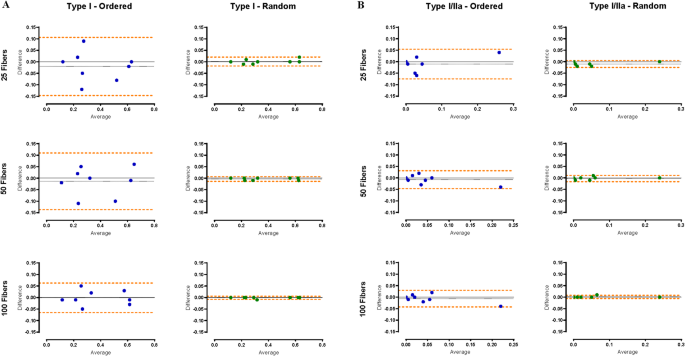
Agreement between estimated and observed proportions of different types of fibers in skeletal muscle when using ordered and random selection for phenotyping isolated muscle fibers. Bland-Altman scatter plots illustrating the agreement between the estimated and observed proportions of Type I (A) and Type I/IIa (B) muscle fibers across all subjects. Estimated proportions are based on either Ordered (left) or Random (right) selection for phenotyping isolated muscle fibers, while observed proportions are determined using all 170 isolated muscle fibers.
The mean difference line in each plot, which when compared to the x-axis, describes the bias of the Ordered or Random approaches when selecting fibers for phenotyping, and the lines for the upper and lower 95% limits of agreement are positioned closer to zero (i.e., the x-axis) for most abundant types of fibers (i.e., Type I) when the Random selection fiber typing is employed across all the number (i.e., 25 vs. 50 vs. 100) of muscle fibers phenotyped (Fig. 4A). However, these lines are closer to zero for most abundant types of muscle fibers when only a large number of muscle fibers are phenotyped in the Ordered selection fiber typing approach. The same observations generally apply to the least abundant types of muscle fibers as well (Fig. 4B). Additionally, when only a few muscle fibers can be phenotyped from a muscle biopsy sample, the systematic bias is considerably reduced with Random selection fiber typing compared to Ordered Selection fiber typing when characterizing the proportion of fiber types in muscle.